
SLIDE 1
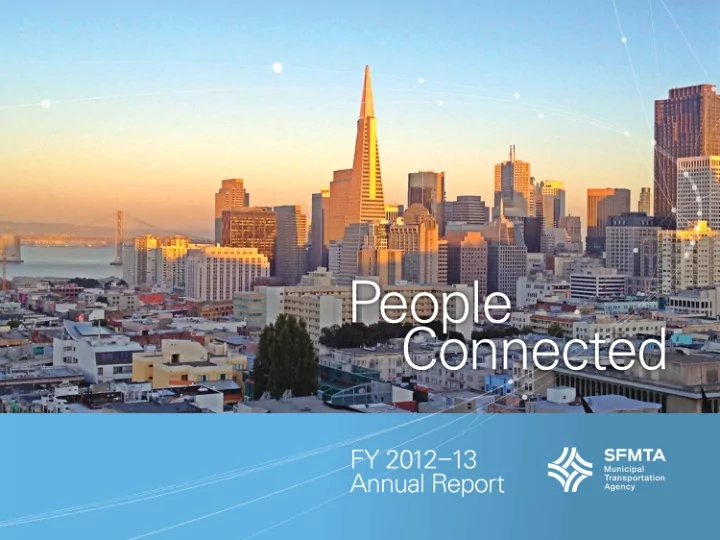
People Connected FY 2012-13 Annual Report Muni Centennial 2 - - PowerPoint PPT Presentation
People Connected FY 2012-13 Annual Report Muni Centennial 2 SFMTA At a Glance 3 SFMTA Core Values For the Transportation For Our Team: Network: Leadership Transit First Teamwork Complete & Green Streets Integrity
2
3
4
San Francisco: great city, excellent transportation choices.
We work together to plan, build, operate, regulate and maintain the transportation network, with out partners, to connect communities.
5
6
1. Improve security for transportation system users 2. Improve workplace safety and security 3. Improve the safety of the transportation system
7
Integration of infrastructure replacement and streetscape enhancements
National recognition: Best public artwork in the United States, Domestic Seating, 2013 Public Art Network Year in Review by Americans for the Arts
Total of 181 San Francisco schools zones in improving pedestrian safety and walkability
Focus on improving safety in busy commercial areas with multiple intersecting streets
A change in measuring practices to more accurately reflect the occurrence on Muni- related crimes
The SFMTA team has substantially reduced workplace injuries this past year
Collision rate has remained fairly constant over the past few years
9
1. Improve customer service & communications 2. Improve transit performance 3. Increase use of all non- private auto modes 4. Improve parking utilization and manage parking demand
10
76X Marin Headlands Express and Red Transit- Only Lanes
JFK Drive Bicycleway & the first Bicycle Bay
More taxis on the streets to meet peak-hour demand
PayByPhone capability at all on-street meters citywide
62 percent of survey respondents rate Muni service as excellent or good
Bunching remained fairly constant at 5-6% of vehicles; gaps between vehicles steadily declined
Preliminary data indicates that the SFMTA will meet this target
SFpark was able to regulate pricing to ensure availability in the pilot areas
12
1.Reduce the Agency’s and the transportation system’s resource consumption, emissions, waste, and noise 2.Increase the transportation system’s positive impact to the economy 3.Allocate capital resources effectively 4.Deliver services efficiently 5.Reduce capital and
13
Full Funding Grant Agreement from the FTA in October 2012
First transit agency in the country to implement all-door boarding on buses
62 new, low-floor biodiesel-hybrid electric buses
SFMTA met the 2012 reduction goal in 2011
Nearly 86,000 hours/month for our riders are lost during transit delays
15
Capital Program Controls System (CPCS) will improve the agency’s project delivery
Expenditures have stabilized during the past three fiscal years
Additional annual need: at $70M for operations and $260M annually for capital State of Good Repair (SGR) investments
16
1. Improve internal communications 2. Create a collaborative and innovative work environment 3. Improve employee accountability 4. Improve relationships and partnerships with
17
18
tools to do their job
Average rating of 3.36 for their overall feeling of satisfaction with their job
19% of employees had performance appraisals; 62% had new performance plans for next year
Running post-construction follow-up surveys
19
20
The SFMTA is working to provide excellent transportation choices while responsibly managing limited resources.
SFMTA Operating Revenues
21
SFMTA Operating Expenses
23
materials and supplies ($27M).
improvements
25
SFMTA Capital Improvement Program (CIP)
26
– Pedestrian safety improvements ($1M) – Overhauls of Muni transit vehicles ($2.5M) – Traffic signal renewals ($1.5M) – Muni Customer First Projects ($20M): N Judah and 14 Mission Complete Street projects ($22M): Masonic Avenue, Second Street and Mansell Avenue in McLaren Park
financing; allows SFMTA capital projects to proceed in advance of receiving full capital funding.
28
29
right-of-way
efficient and effective workforce
30
Task Force
sister city agencies and community groups
planning and to improve infrastructure:
– Updated 20-year Capital Plan – New Transit Fleet Plan – Bicycle and Pedestrian Strategies – FY2015 – FY 2016 Operating and Capital Budget under development
31
Duboce
Lea Militello
32
In order to deliver outstanding services, the SFMTA must create a collaborative and engaging work environment that trains, encourages, and supports its staff at all levels, while holding each other and the agency accountable.
34
Agency-wide Results
working at the SFMTA
35
*Percentages & averages are weighted by division headcounts.
Agency-wide Results
36
*Percentages & averages are weighted by division headcounts.
Agency-wide Results
38
*Percentages & averages are weighted by division headcounts.
Best Areas of Performance
conflicts by working collaboratively with others (71%)
share job knowledge to solve problems effectively (66%)
personal accomplishment (65%)
Areas of Opportunity
leadership of the SFMTA (39%)
suggestions are welcomed and acted upon quickly and appropriately (39%)
communication between leadership and employees has improved (38%)
40
% represents Strongly Agree and Somewhat Agree responses % represents Strongly Disagree and Somewhat Disagree responses
Key Themes to Address:
communication with employees
guidelines
additional training
41