
Do pedestrians comply with traffic lights in Belgian cities?
Kevin Diependaele
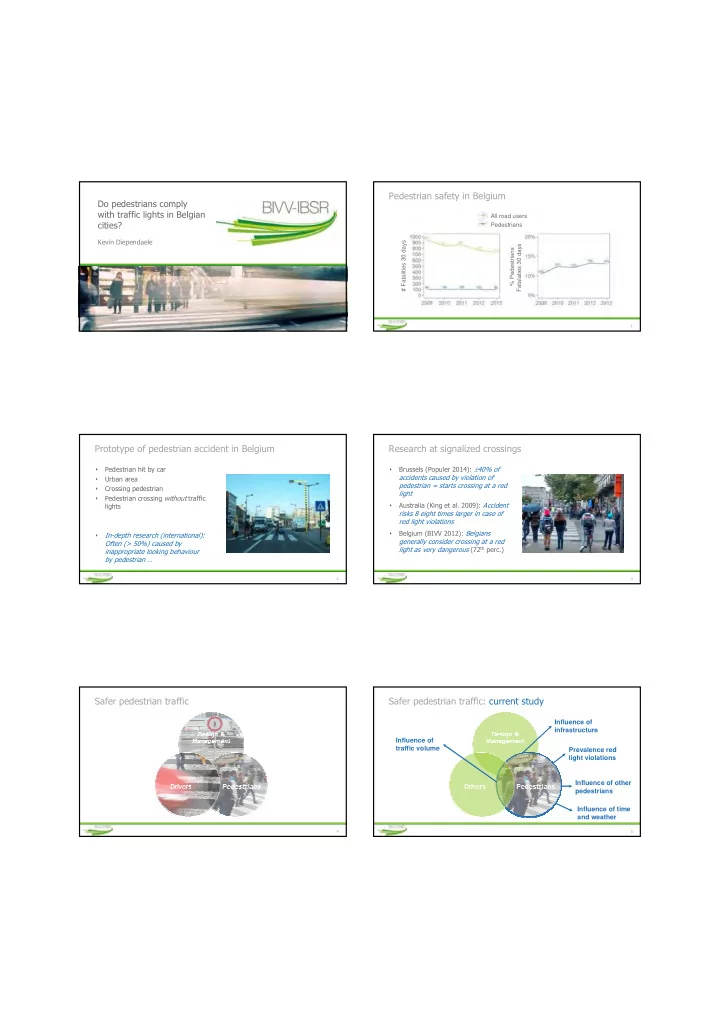
1Pedestrian safety in Belgium
All road users Pedestrians # Fatalities 30 days % Pedestrians Fatalaties 30 days
- Pedestrian hit by car
- Urban area
- Crossing pedestrian
- Pedestrian crossing without traffic
lights
- In-depth research (international):
Often (> 50%) caused by inappropriate looking behaviour by pedestrian …
2Prototype of pedestrian accident in Belgium
- Brussels (Populer 2014): ±40% of
accidents caused by violation of pedestrian = starts crossing at a red light
- Australia (King et al. 2009): Accident
risks 8 eight times larger in case of red light violations
- Belgium (BIVV 2012): Belgians
generally consider crossing at a red light as very dangerous (72th perc.)
3Research at signalized crossings
4Safer pedestrian traffic
5Safer pedestrian traffic: current study
Influence of infrastructure Influence of traffic volume Prevalence red light violations Influence of other pedestrians Influence of time and weather