SLIDE 1 Partial melting of mantle peridotite
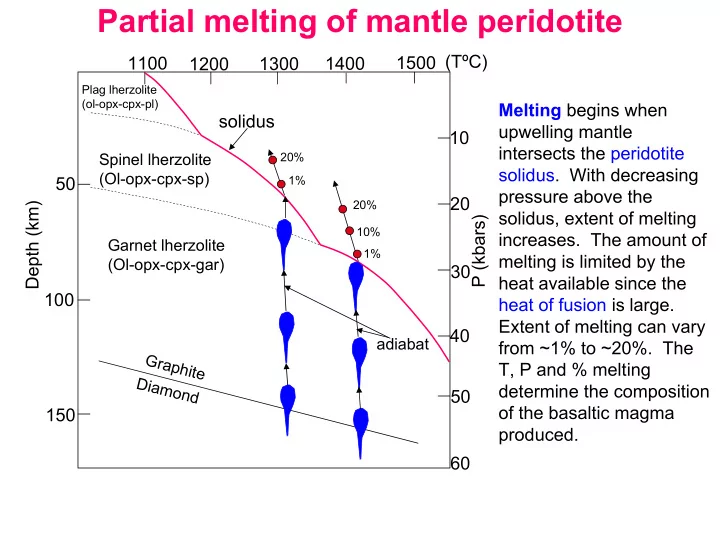
Melting begins when upwelling mantle intersects the peridotite
pressure above the solidus, extent of melting
melting is limited by the heat available since the heat of fusion is large. Extent of melting can vary from ~1% to ~20%. The T, P and % melting determine the composition
produced.
G r a p h i t e Diamond
solidus
Spinel lherzolite (Ol-opx-cpx-sp) Garnet lherzolite (Ol-opx-cpx-gar)
20% 1% 20% 10% 1%
10 20 30 40 50 60 P (kbars) 50 100 150 Depth (km) 1100 1200 1300 1400 1500 (TºC)
Plag lherzolite (ol-opx-cpx-pl)
adiabat
SLIDE 2 Composition of melt depends on the P and T (which controls the extent of melting) and the phases involved in the melting. Suppose that ~1/3 (opx) + ~1/3 (cpx) + ~1/3 (garnet) were melting. Opx and cpx contain ~54% SiO2 and garnet contains ~ 42%
- SiO2. The melt would contain [1/3(54) +1/3(54) + 1/3(42)]% SiO2, i.e., ~ 50% SiO2. In
- ther words, magmas formed by mantle melting will contain ~50% SiO2 (basalt).
How does melting occur in the mantle?
Melting of garnet lherzolite begins at
cpx-cpx-garnet triple junctions in
response to a reduction in pressure. Olivine is not involved in melting at early stages.
Gar Cpx Opx Gar Cpx Opx OL OL Olivine OL OL O OL
As the extent of melting increases, melt migrates along grain boundaries forming an inter-connected network that allows the melt to segregate from the unmelted crystal residue.
G C O G C O OL OL OL OL OL O OL
SLIDE 3 Schematic view of some processes in basalt formation
Rapid ascent of magma thru narrow conduit Near-surface magma chamber (+ differentiation)
Crust Mantle
“Trapping” of melt at A – L boundary (high pressure fractionation) “Failed” eruptions (cause metasomatism of lithosphere) mantle xenoliths sill dike sill
Diapir Lith. Asth.
Crustal Underplating (+ differentiation) Eruption of fractionated magma Flood Basalt Eruption of primary magma (± xenoliths) Melt accumulation partial melting crustal xenoliths
SLIDE 4 Melting and crystallization
Understanding the partial melting processes that produce magmas and the subsequent crystallization and differentiation processes that modify these magmas forms the heart of igneous petrogenesis. To understand these processes, it is necessary to understand thermodynamics of macroscopic systems and chemical
- kinetics. There is a large body of published work that has applied thermodynamic
principles to petrogenesis of igneous rocks (and also metamorphic rocks), the most comprehensive work being that of Mark Ghiorso who has, over the past 25 years, developed and refined an algorithm that permits one to calculate details of melting and crystallization processes over a wide range of compositions, temperatures and
- pressures. This work is encoded in MELTS, an online computer program that will do
the requisite complex computations. The basic principle in MELTS involves the fundamental condition for equilibrium, namely that a chemical system of a specific composition at a specific P and T will minimize the total Gibbs Free Energy. Using this principle and a huge library of experimental data obtained over the past century, Mark’s program is applicable over a wide range of temperatures, pressures and
- compositions. While the implementation of MELTS has “black box” aspects to it, it is
a very powerful way to understand melting and crystallization in the earth. In this class, we will not attempt to delve too deeply into the theoretical aspects
- f melting and crystallization since few in this class have the requisite background,
but, rather, we will use experimental data obtained on simple systems to illustrate the
- processes. One basic rule of thermodynamics that we must understand at the outset
is the phase rule, so we will start there.
SLIDE 5 Experimentally determined phase diagrams are used extensively by petrologists to elucidate the details of crystallization and/or melting phenomena in igneous systems. At the present time there are basically two approaches used by experimental petrologists: [1] Detailed studies of “simple” systems containing fewer than 5 components. These are called model or analog systems. Simple systems have the advantage that the phase equilibria can be accurately expressed in a phase diagram and a large number of compositions can be examined. In addition, compositional variables can be well controlled. The main deficiency of simple systems is that they may not adequately model the phase equilibria occurring in natural systems. [2] Melting and crystallization studies on “real” rocks, i.e., naturally occurring
- samples. In this approach, the results can be directly applied to the particular rocks
being studied but they are limited in the sense that only one composition is being
- studied. In addition, the fact that real rocks contain at least 10 major components
makes the graphical depiction of phase equilibria rather difficult. With modern experimental equipment, petrologists are able to control all the important variables, i.e., T, P, and the partial pressures (actually fugacity) of volatile species such as H2O, CO2, SO2 and O2. In this introduction to phase equilibria we will consider temperature (T), and composition (X) as the main variables. The appropriate pressure is noted at the top of each diagram.
PHASE EQUILIBRIA AND PHASE DIAGRAMS
SLIDE 6
At the outset, it is important to know the phase rule which can be written as:
f = c - p + 2
where c = number of components, i.e., the minimum number of chemical species that alone, or in varying proportions, define the chemical compositions of all the phases in the system. p = number of phases. A phase is a homogeneous state of matter that is physically separable from other phases in the system. Each mineral type constitutes a phase (even if the mineral is a solid solution), the liquid is a single phase (except in rare cases where liquid immiscibility occurs) and the gas (if present) is a single phase. f = number of degrees of freedom, i.e., the number of variables that can be independently changed without causing a change in the number or types of phases in a system. If either of the variables T or P is held constant, we have the reduced phase rule f = c - p + 1 If both of the variables T and P are held constant, we have the reduced phase rule f = c - p
The Phase Rule
SLIDE 7
The phase rule was originally derived from thermodynamic principles by J. Willard Gibbs and hence it is commonly known as the Gibbs Phase Rule. It is widely used in both igneous and metamorphic petrology to predict the number of phases that can be present in equilibrium assemblages. Phase assemblages with zero degrees of freedom are invariant (f = 0) Phase assemblages with one degree of freedom are univariant (f = 1) Phase assemblages with two degrees of freedom are divariant (f = 2) Phase assemblages with three degree of freedom are trivariant (f = 3), etc. Important principles of crystallization and melting can be demonstrated by examining a few, relatively simple, systems. Phase diagrams for one-, two-, three- component and higher order systems are widely used by petrologists to understand and illustrate the details of crystallization and/or melting. It is important to keep in mind, however, that natural systems are compositionally much more complex and will consequently show somewhat more complex behavior. The Phase Rule (cont.)
SLIDE 8 Before we start looking at simple systems, let’s look at natural examples to provide some context of what it is that we are trying to explain by spending huge amounts
- f time and energy doing difficult experiments in the lab.
PHASE EQUILIBRIA AND PHASE DIAGRAMS
1170ºC 1130ºC 1075ºC 1020ºC
Photomicrographs of thin sections of samples collected from variable depths and temperature from Makaopuhi lava lake, Hawaii. Note:
- 1. Increasing crystallinity
with decreasing T
- 2. Crystallization sequence:
- l
plag cpx FeTi-ox
(increasingly dark to 1075ºC, clear at 1020ºC)
SLIDE 9 % Glass T ºC 1200 1100 1000 9000 20 40 60 80 100
1250 1200 1150 1100 1050 1000 950 10 10 20 10 10 20 30 40 30 50 40 50
Liquidus Melt Crust Solidus Olivine Clinopyroxene Plagioclase Opaque
100 90 80 70 60 50 .7 .8 .9 .9 .8 .7 .6 80 70 60
An Mg / (Mg + Fe) Weight % Glass Olivine Augite Plagioclase Mg / (Mg + Fe)
Note: (1) olivine increases then decreases in amount as Xn proceeds. (2) Change in compn of the phenocrysts as Xn proceeds--Ferromag. minerals become increasingly Fe rich and plagioclases become more Na rich