
SLIDE 1
5/25/2017 1
1
Pahiatua WWTP discharge to the Mangatainoka River
May 2017
- Dr. Olivier Ausseil
Aquanet Consulting Ltd
2
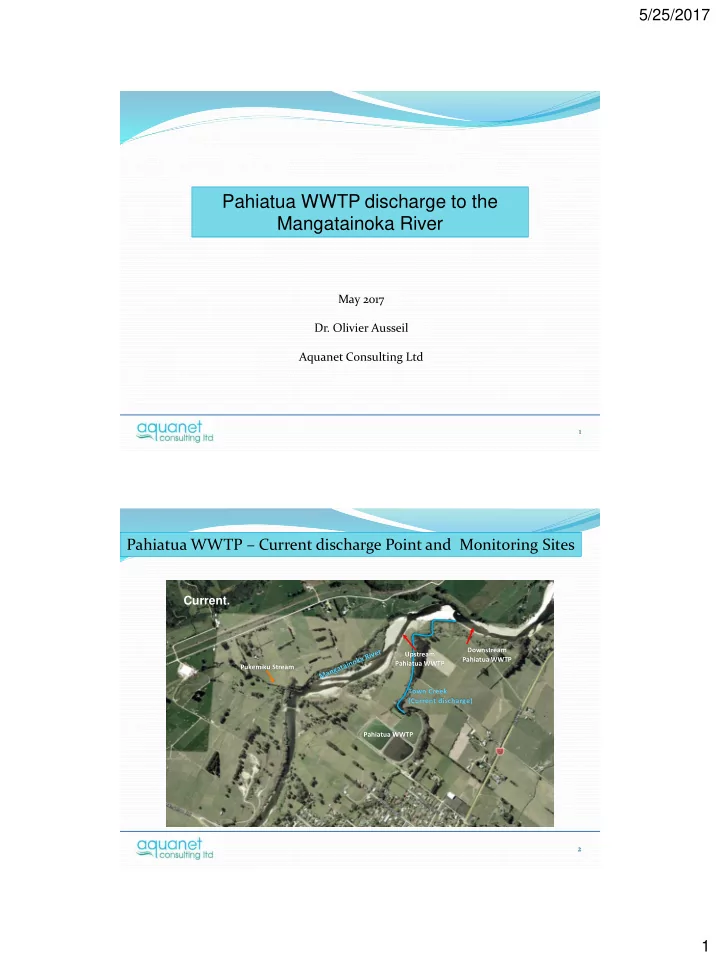
Pahiatua WWTP – Current discharge Point and Monitoring Sites
Pahiatua WWTP Town Creek (Current discharge) Pukemiku Stream Upstream Pahiatua WWTP Downstream Pahiatua WWTP