
SLIDE 1
Oxygenated volatile organic compounds in the remote marine - - PowerPoint PPT Presentation
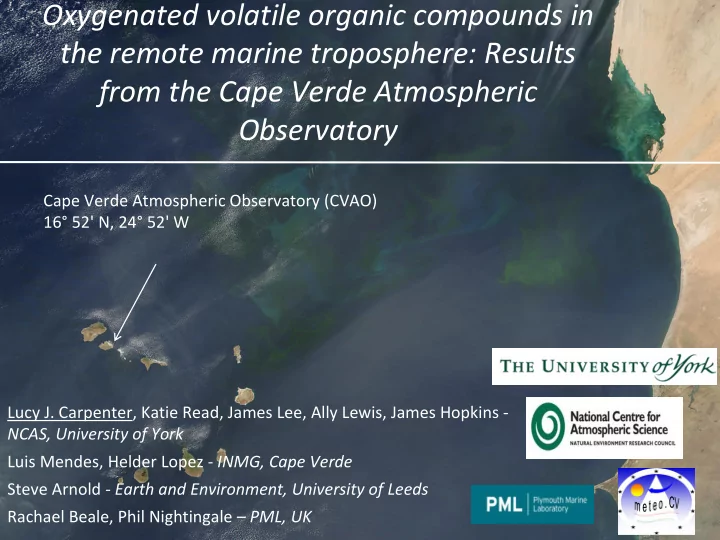
Oxygenated volatile organic compounds in the remote marine troposphere: Results from the Cape Verde Atmospheric Observatory Cape Verde Atmospheric Observatory (CVAO) 16 52' N, 24 52' W Lucy J. Carpenter, Katie Read, James Lee, Ally Lewis,
Measurement Method Met stations at 10, 30m Various O3 UV absorption NO/NOx/NOy Chemiluminesence CO VUV Fluorescence C2 -C8 NMHCs and DMS dc-GC-FID C1 -C5 O-VOC dc-GC-FID Halocarbons GC-MS JO1D Radiometer
Methanol Acetaldehyde Acetone
Cape Verde Atmospheric Observatory (CVAO)
Ocean: source or sink? Biogenic sources Anthropogenic and biomass burning sources
Primary and secondary sources
CH3 C(O)O2 NO2 PAN HO2organic acids HCHO, HOx , CH3 O2 h, O2 , OH h, O2 , OH
10 100 1000 10 100 1000 10000
acetone (pptV) propane ( pptV)
Acetaldehyde (nM) Latitude
Acetaldehyde in Mauritanian Upwelling (ICON)
Filament 1 Filament 2
Acetaldehyde (nM) Days since patch initiation (T0 )
AMT track
Beale, R. Quantification of oxygenated volatile organic compounds (OVOCs) in seawater, 2011, Ph.D thesis, University of East Anglia, UK. Manuscripts in preparation.
500 1000 1500 2000 2500 Jan Feb Mar Apr May Jun Jul Aug Sep Oct Nov Dec acetone (pptV) 500 1000 1500 2000 2500
01/01/2007 20/02/2007 11/04/2007 31/05/2007 20/07/2007 08/09/2007 28/10/2007
10th‐90th percentile range Mean (measurements) CAM‐Chem STD model STD‐NOANTH STD‐NOBIO STD‐NOFIRE CAM‐Chem model with ocean
y = 20.02x + 0.59 R
2 = 0.39
y = 3.39x + 0.28 R
2 = 0.71
y = ‐3.08x + 3.44 R
2 = 0.83
0.0 0.5 1.0 1.5 2.0 2.5 3.0 3.5 0.00 0.10 0.20 0.30 0.40 0.50 0.60 0.70 0.80 0.90 1.00 Fractional contribution to acetone O b s e rv e d /m od e lle d
10 100 1000 1 10 100 1000 10000
acetaldehyde (pptV) propane (pptV)
50 100 150 200 250 Oct/06 Dec/06 Jan/07 Mar/07 May/07 Jul/07 Sep/07 Nov/07 Jan/08 Mar/08 CO (ppbV)
Using nOH (fossil fuel and biomass) methane oxidation terrestrial nmhc oxidation (mainly isoprene)
terrestrial ovoc oxidation
Additional % contribution from summer CO emission sources not shared by ethane Reference Methane oxidation 5 % (May-October) Granier et al., 2000 NMHC oxidation 12 % (May-October) Granier et al., 2000 Terrestrial
20 % (June-November) Miller et al., 2008 Oceanic NMVOC
20 % (July-September) Guenther et al., 1995
50 100 150 200 250 Oct/06 Dec/06 Jan/07 Mar/07 May/07 Jul/07 Sep/07 Nov/07 Jan/08 Mar/08 CO (ppbV)
Using nOH (fossil fuel and biomass) methane oxidation terrestrial nmhc oxidation (mainly isoprene)
terrestrial ovoc oxidation