Overview The New HMD-LQ Model Life Tables Age pattern of human - - PDF document

overview
SMART_READER_LITE
LIVE PREVIEW

Overview The New HMD-LQ Model Life Tables Age pattern of human - - PDF document

Overview The New HMD-LQ Model Life Tables Age pattern of human mortality and Their Application to the Analysis Model life table families of Census Household Deaths Data The HMD-LQ model Household deaths data Griffith Feeney


slide-1
SLIDE 1

1

The New HMD-LQ Model Life Tables and Their Application to the Analysis

  • f Census Household Deaths Data

Griffith Feeney <feeney@gfeeney.com> Talk at Statistics South Africa Friday 6 July 2012

Overview

  • Age pattern of human mortality
  • Model life table families
  • The HMD-LQ model
  • Household deaths data
  • HMD-LQ analysis of HH deaths data
  • Observations, Next Steps, Conclusion

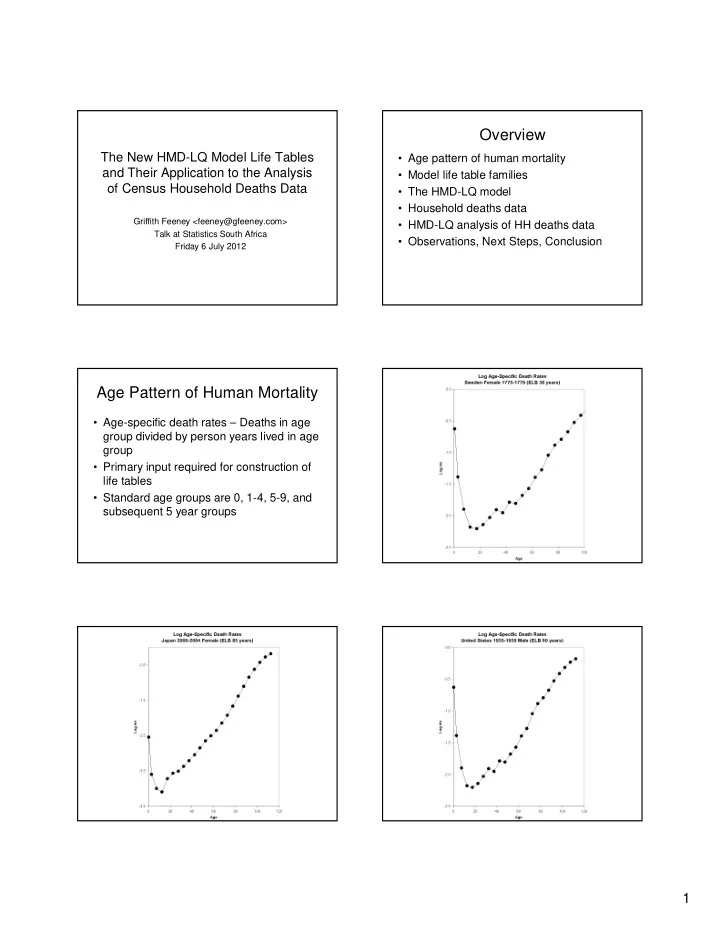
Age Pattern of Human Mortality

  • Age-specific death rates – Deaths in age

group divided by person years lived in age group

  • Primary input required for construction of

life tables

  • Standard age groups are 0, 1-4, 5-9, and

subsequent 5 year groups

slide-2
SLIDE 2

2

Model Life Table Families

  • Parameterized collection of age schedules
  • f mortality
  • Intention is to fit empirical schedules
  • Coale-Demeny 1966, United Nations 1982

The HMD-LQ Model

  • New kid on the block – Will it displace

Coale-Demeny?

  • The Name - Human Mortality Database

Log Quadratic

  • Here’s how it works …
  • But first, the reference - Population

Studies, Vol. 66, Issue 12, December 2011

http://demog.berkeley.edu/~jrw/Eprints/ demog.berkeley.edu/˜ jrw/LogQuad/

slide-3
SLIDE 3

3

How Well Does It Work?

  • What goodness of fit can we expect?
  • Begin by fitting to 3 HMD life tables, which

it was constructed to fit

  • Can’t expect better fits to non-HMD life

tables

  • Fit to the same three tables I showed you

to illustrate the age pattern of mortality

Household Deaths Data

  • HHD data – derived from population

census question on deaths in households

  • E.g., “Any deaths in this household during

the past 12 months?”

  • If yes, record age (completed years) and

sex of each decedent

  • Tabulate deaths by sex and age (0, 1-4, 5

year groups to old open ended group)

South Africa 2011 Census

slide-4
SLIDE 4

4

Namibia 2011 Census Examples of HH Deaths Data

  • Let’s look at some examples of HHD data
  • By which I mean look at Log ASDR plots
  • Here are examples from 7 censuses in 4

countries

  • Rates shown are calculated without

adjustment for completeness of reporting

slide-5
SLIDE 5

5

Application of the HMD-LQ Model to HH Deaths Data

  • Idea: Measure the size of the “hump”
  • Define measure of goodness of fit, choose

parameter h to minimize this

  • Excel implementation of HMD-LQ
  • What measure of goodness of fit is

appropriate, given that we do not expect the model to fit the “hump”?

slide-6
SLIDE 6

6

slide-7
SLIDE 7

7

Observations

  • Fit to ASDRs from age 0-20 years is okay
  • Fit to ASDRs over 50-60 years is not good
  • What explanation? Model or data?
  • The “hump” is observed in high HIV

prevalence countries

  • This and epidemiology of HIV-AIDS

suggests it reflects AIDS-related deaths

Thoughts on Next Steps

  • Estimate completeness of reporting - Hill’s

1987 Generalized Growth Balance Method

  • Refit HMD-LQ to rates adjusted for

completeness of reporting

  • Use model fit to estimate excess deaths
  • Model excess deaths implied by fit, e.g.,

with Weibull distribution

  • Model overall mortality by HMD-LQ plus

Weibull “hump”

Conclusions

  • Existence of “hump” established
  • Hump reflects HIV/AIDS deaths –

evidence is circumstancial, but powerful

  • Household deaths data may prove to be a

powerful tool for assessing adult mortality impact of HIV/AIDS

Thank you!

  • Questions?
  • Comments?
  • Look for files containing these slides and

related material at

gfeeney.com/presentations/2012-the-new-hmd-lq-model-life-tables