
SLIDE 1
10/10/2014 1
ECE 553: TESTING AND TESTABLE DESIGN OF DIGITAL SYSTES DIGITAL SYSTES
Sequential circuit ATPG
Overview
- Motivation
- Sequential circuit ATPG
- An example test generation
- Time-frame expansion
- Nine-valued logic
- ATPG implementation
10/10/2014 2
p
- Complexity of ATPG
- Cycle-free and cyclic circuits
- Test generations systems
– Classification – Forward time test generator – FASTEST – General comments – Simulation based test generators – contest, strategate
- Summary
Motivation
- A sequential circuit has memory in addition
to combinational logic.
- Test for a fault in a sequential circuit is a
f hi h
10/10/2014 3
sequence of vectors, which
- Initializes the circuit to a known state
- Activates the fault, and
- Propagates the fault effect to a primary output
Sequential circuit ATPG
- Methods
– Time-frame expansion methods
- Forward time, reverse time, forward and
10/10/2014 4
, , reverse time
– Simulation-based methods
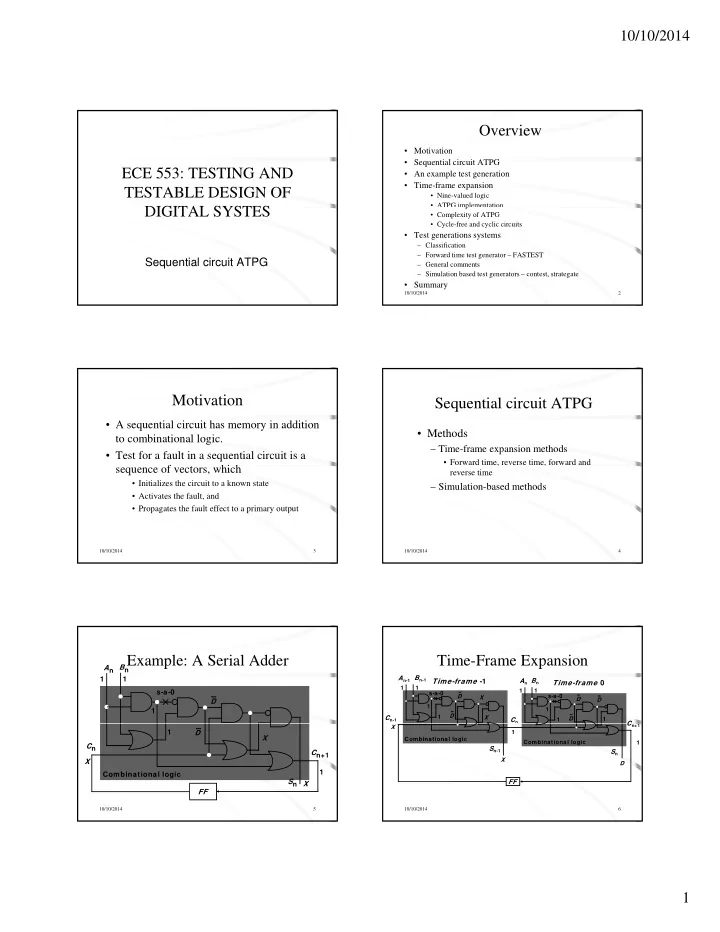
Example: A Serial Adder
An Bn s-a-0 1 1 1 D
10/10/2014 5
FF Cn Cn+1 Sn 1 1 X X X D Combinational logic
Time-Frame Expansion
An Bn Cn C
1 X s-a-0 1 1 1 1 D D s-a-0 1 1 1 1 X D D
Cn-1
D
An-1 Bn-1
Time-frame -1 Time-frame 0
10/10/2014 6
FF Cn+1
X
Sn
Combinational logic
Sn-1
Combinational logic 1 1 D X