
SLIDE 1
Overview of Gasification Activities at GE George Rizeq GE Global - - PowerPoint PPT Presentation
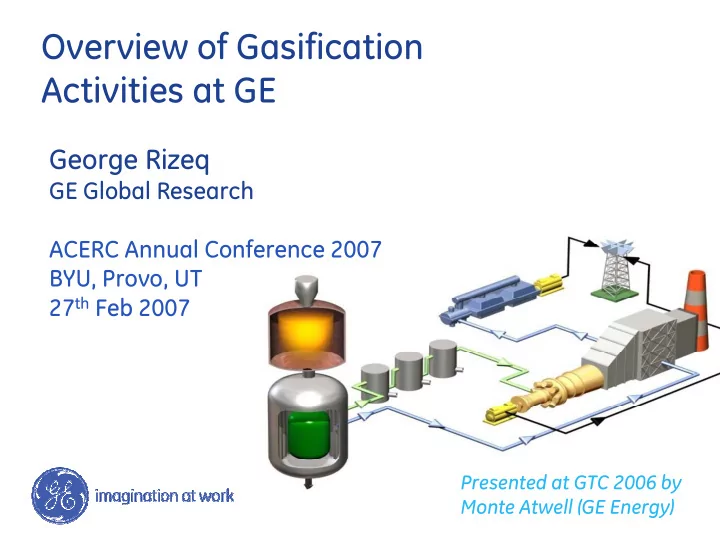
Overview of Gasification Activities at GE George Rizeq GE Global Research ACERC Annual Conference 2007 BYU, Provo, UT 27 th Feb 2007 Presented at GTC 2006 by Monte Atwell (GE Energy) Technology Drivers Reference Plant System Design Concept
2
Houston
3
China India
Coal Slurry Spray Gas Flow & Heat Recovery Validation Data Field Optimization Injection Test Gasification Kinetics Metal Coatings & Refractory
4
TG2 TG1 TG3 TG4 TG5 TG6 TG7
5
Sub- Systems Owners
6
Syngas Cooler Refractory Controls Steam Turbine Gas turbine
CO2 Recycle Slurry Oxygen
CO2 Recycle
Injectors
ASU
7
Specification Target
Conversion +30% Tip life +100% Turndown Capability to 50%
↓ Fines in Slag ↓ Heat Rate
hopper dumps
separation equipment
↓ Recycled
for less fuel input to gasifier
Fines
due to reduced solids loading in settlers
grey water tank increasing the life of downstream components
↓ Gasifier Operating Temperature
gasifier can be operated at a lower temperature
to lower temperatures
Injector D1 Injector D2
8
9
S2
Design Cycle
Analytical Models & Experimental Validation
Design Optimize Analyze Validation Measure
Deposition Modeling Spray Quench Cost vs. Risk vs. Performance Fouling Samples Fleet Leader Instrumentation Define
10
SGC SGC SGC Trans Trans Trans Const Const Const Risk 1 2 3 Cost Size Reduction = Cost Reduction
11
P e rs0’
P e rsFLOOR CEILING
temperature data
data for transients
materials and fabrication
temperature to simulate Ref Plant
feedstock
12
Chemical mapping reveals interaction between slag and refractory surface Slag penetrates the grain boundaries within the refractory brick
Slag (Cr,Al)2O3
13
Temperature
14
) ( ) (
4 4 2 2
= − + − + ∂ ∂ − ∂ ∂ + ∂ ∂
w h w h h h h h p h h p h
T T A T T A U x T A x T c t T Ac σε κ υ ρ v
) ( ) (
2 2
= − + − + ∂ ∂ − ∂ ∂
c w c h w h w w w p w
T T A U T T A U x T A t T Ac κ ρ ) (
2 2
= − + ∂ ∂ − ∂ ∂ + ∂ ∂
w c c h p c h h c
T T A U x H c A x H t H A κ υ ρ v
Metal Wall Syngas Tube Water Tube Operator Training Simulator Engineering Simulator Control Hardware Emulator Simulation Model Control Software Instructor Station
Engineering Class Simulation for Controls Operability & Operator Training
Generate Physics Based Transient Equipment Models
15