
SLIDE 1
1
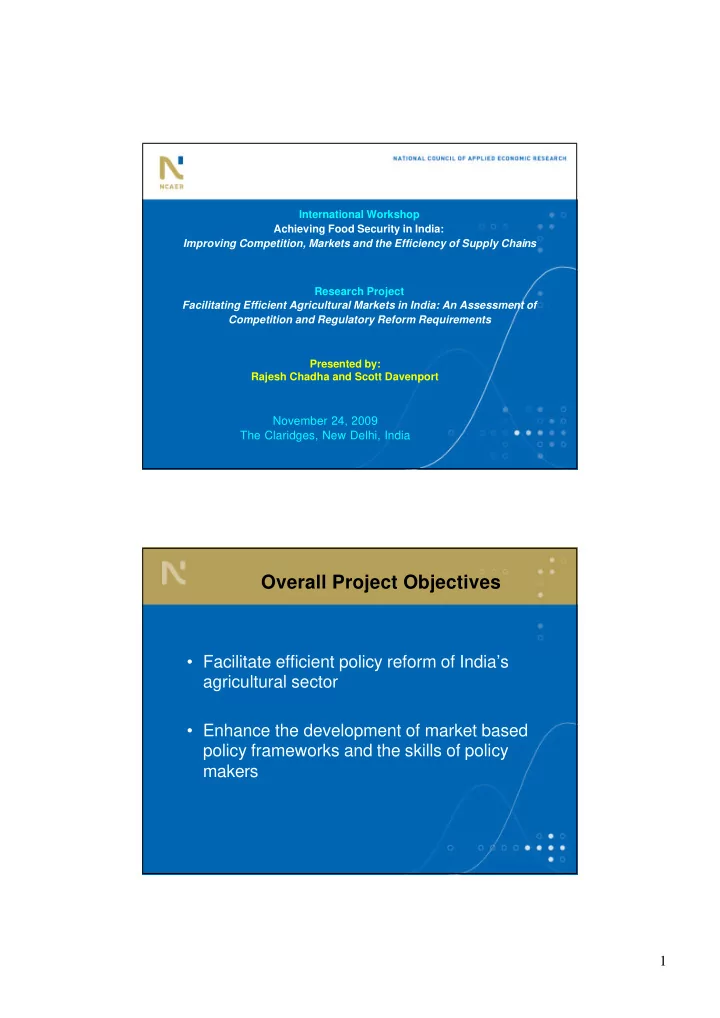
International Workshop Achieving Food Security in India: Improving Competition, Markets and the Efficiency of Supply Chains Research Project Facilitating Efficient Agricultural Markets in India: An Assessment of Competition and Regulatory Reform Requirements Presented by: Rajesh Chadha and Scott Davenport
November 24, 2009 The Claridges, New Delhi, India
Overall Project Objectives
- Facilitate efficient policy reform of India’s
agricultural sector
- Enhance the development of market based