
SLIDE 1
OVE VERVIE VIEW W : DEMOGRAPHICS BACKGROUND DATA Karoo Hoogland - - PowerPoint PPT Presentation
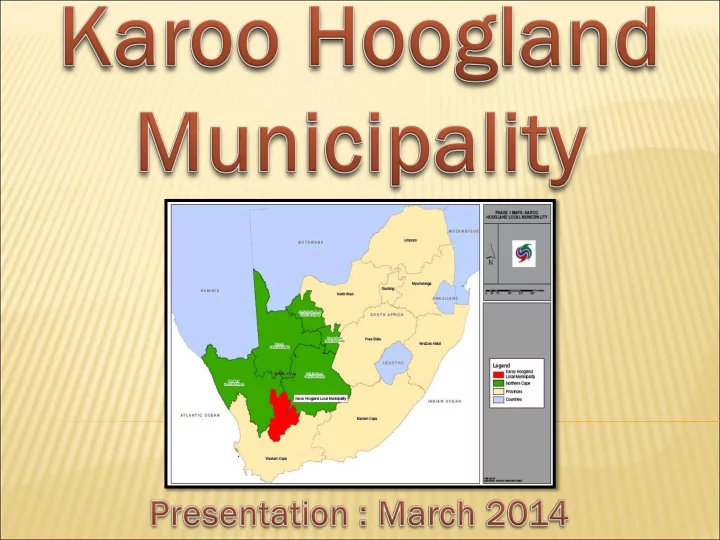
OVE VERVIE VIEW W : DEMOGRAPHICS BACKGROUND DATA Karoo Hoogland Municipality consists of Sutherland, Williston and Fraserburg and surrounding rural area. The municipality comprises an area of 32 274 km 2 and falls within the area of
BACKGROUND DATA Karoo Hoogland Municipality consists of Sutherland, Williston and Fraserburg and surrounding rural area. The municipality comprises an area of 32 274 km2 and falls within the area of jurisdiction of Namakwa District Municipality. Households * 2204 (Households serviced) Population * 11601 (Sensus 2011) Registered erven * 4398 Total Households * 3388 (Including Rural areas) Indigents * 1035 Households with access to water and basic services : 2204 Households with access to sanitation : 2204 Households with access to electricity : 1984 Households with access to refuse removal: 2204
Karoo Hoogland Municipality have a total population of approximately 11 601 according to STATS SA Survey done in 2011. Karoo Hoogland is situated in the most Southern part of the Northern Cape and falls within the area of jurisdiction of Namaqua District Municipality with its head office located in Springbok. Fraserburg : 23% of total population / Non Urban areas (Rural) : 31% of total population Sutherland: 19% of total population / Williston : 27% of total population It is evident that the most significant portion of Karoo Hoogland’s urban population resides in Williston (27%). The Karoo Hoogland LM also has a large rural population, with 31% of its population residing in the non-urban (NU) regions within the Municipality which covers approximately 99% of the LMs geographical area. A large number of residents are still dependant on government grants and is the unemployment rate currently 23.1%. This tendanst in it self have a negative influence on the payment of services. The Karoo Hoogland population can be regarded as having a high dependency ratio. With 10.6% of the population over the age of 65 and 24.5% are under 15 years. The latter youth group will be demanding education, housing and jobs in the near future. The Karoo Hoogland gender distribution is 47, 8% males and 52, 2% females.
AUDITOR GENERAL’S REPORT ON THE MUNICIPALITY
DISCLAIMER OPINION FOR 9 YEARS UNTILL 2008/09 QUALIFIED OPINION FOR 2009/2010 QUALIFIED OPINION FOR 2010/11
CURRENTLY BEING AUDITED FOR 2011/12 WILL BE AUDITED FROM MAY 2014 FOR 2012/13 ALL EFFORTS ARE FOCUSED TO OBTAIN A CLEAN AUDIT ON 30 JUNE 2014
OVERALL
ERALL FINANCI NANCIAL L STAB ABIL ILIT ITY Y & CAP APACITY
CASHFLOW HAS IMPROVED DRASTICALLY.. CASHFLOW POSITION AND INDICATION OF THE CURRENT MUNICIPAL RESERVES IN THE
BANK
REPORT ON BAD DEBT WRITE OFF POLICY
PAYMENT LEVELS as at February 2014 are 64 %.
AUDIT COMMITTEES & THEIR FUNCTIONALITY AS WELL AS
MUNICIPAL AUDITING/INTERNAL AUDIT SHARED SERVICES
PLAN TO ENTER
R INTO AGREEM EMEN ENT T WITH HANTAM MUNICIPALI ALITY FOR SHARED ED SERVICES CES FOR THE INTERN RNAL AL AUDIT T UNIT
MONTHLY REPORTING
SECTION
ION 71 REPORTS S UP T TO DATE
ANNUAL REPORTING
ANNUAL
UAL REPORT 2012/2 /2013 3 (SUBMITT ITTED ED IN JANUARY UARY 2014)
REVENUE
UE COLL LLECTIO ION & PROJE JECT CTIO IONS NS
Revenue collection remains a problem for most
MUNI NICIP CIPAL AL FINA NANC NCIAL IAL VI VIABILIT ILITY Y & MANA NAGEME EMENT NT
REVENU
NUE
Due to severe financial restrictions the revenue budget of the
municipality had to be curtailed in order to be able to make tariffs more
functionality of the municipality. Maintenance and training are amongst the first casualties.
MUNI NICIP CIPAL AL FINA NANC NCIAL IAL VI VIABILIT ILITY Y & MANA NAGEME EMENT NT
CASH FL
FLOW W POSITION ON
Due to stringent controls and the curtailing of expenditure the municipality is
able to fulfil its obligations. Reserves are however only available to fund the current budget and any increase in expenditure will have a negative impact.
INDIGENT
GENT
More than a third of the community in KHM is considered to be indigent. More
than 1035 of the 2204 households have registered. The annual process of evaluation is currently under way.
The registration is done on annual basis and community participation in the
process is encouraged. While a cut-off date is set for administration processes, consumers are continuously invited to apply.
Community Development workers and ward councillors are tasked to assist
SPEC
ECIAL IAL FOCUS S ON LED ED
In the vision of Council it is stated that Karoo Hoogland Municipality must be an economical
growth node and Council must create an environment that will enhance economic development with special focus on poverty alleviation and the creation of direct and indirect job opportunities. Special focus will also be placed on the development of life skills of people, infrastructure and education.
ALIGNM IGNMENT NT WITH H PROVINCI INCIAL L IDP AN AND LED ED STRATEGIE GIES
THE LED STRATEGIES OF COUNCIL IS DIRECTLY ALIGNED WITH THE PROVINCIAL GROWTH
AND DEVELOPMENT STRATEGIES WITH SPECIAL REFERENCE TO THE FOLLOWING:
PROJECT NR PROJECT NAME LOCATION
5.1.11
SMME DEVELOPMENT :
ALL WARDS
AS AS DETERM ERMIN INED ED IN T THE IDP
Break down of the total Capital Revenue for 2013/14 and 2014/15 year.
MIG AM AMOU OUNT: : 2013/1 3/14 4 : R 10 805 000 / 2014/1 4/15 5 : R 8 890 000
Break down of the total Capital Expenditure for 2013/14 financial year.
MIG AM AMOU OUNT: : 2013/1 3/14 4 : R 10 805 000
What sort of investments do you have in your municipality and what is mainly
used for? KAR AROO O HOOGLAND LAND MUNIC ICIP IPALIT LITY Y DOES ES NOT HAVE E AN ANY INVESTM TMENTS NTS
Break
ak down wn of the 2013/1 13/14 4 Service ice Deliver ery y and Bud udget t imp mplem ementat entation ion Plan
List of capital project per ward and including budgeted amount.
WARD 1:WILLISTON – HIGH MAST LIGHTING = R 1 788 730 WARD 2:FRASERBURG – STREET LIGHTING = R 780 572 WARD 2:FRASERBURG – UPGRADING OF OXIDATION PONDS = R 12 098 527
PROJECTS JECTS TO BE REGISTERED TERED WITH MIG:
WARD 4:SUTHERLAND – STREET LIGHTING = R 743 701 ALL THREE WARDS : UPGRADE OF INTERNAL GRAVEL ROADS = R 8 000 000 ALL THREE WARDS: UPGRADE OF SPORT FACILITIES = R 7 411 140
Status
tus of se sectora
ster er plans: s: approval al st status us and the targeted ed backlog log
Spatial development Plan
(APPROVED ON 8 M MARCH 2011, 1, COMPILED D BY UMSEBE) BE)
Water Master
(FRASER SERBURG URG AND S SUTHER HERLAND WATER PLANS DONE IN 2010/11) 1) (WILLISTON ON WATER PLAN IN PROCESS S 2014/20 /2015) 5)
Electricity Plan
(WILLISTON ON : 2 2006, FRASERBU BURG G :2011) 1)
MIG FUNDS RECEIVED: 2005/2006 MIG Allocation
1 966 000.00 2007/2008 MIG Allocation 1 065 000.00 2008/2009 MIG Allocation 3 477 000.00 2008/2009 Namakwa DM 1 200 000.00 2009/2010 MIG Allocation 5 941 000.00 2010/2011 MIG Allocation 6 753 000.00 2010/2011 Namakwa DM 4 550 545.45 2011/2012 MIG Allocation 9 383 000.00 2011/2012 Namakwa DM 2 871 849.75 2011/2012 Electrification Projects DoE 2 500 000.00 2012/2013 Electrification Projects DoE 4 000 000.00 2012/2013 MIG Allocation 11 381 000.00 2013/2014 MIG Allocation 10 805 000.00 2013/2014 RBIG FUNDS 900 000.00 2013/2014 ACIP 600 000.00
Funds were allocated to District Municipality during these years
FUNDS WERE PRIORITIZED IN THE DIFFERENT SECTORS AS FOLLOWS:
WATER
MIG G : BULK WATER R SUPPLY AT WILLISTON ON 727 HOUSEHOL OLDS DS MIG G : UPGRA RADE DE OF WATERNE ERNETWORK ORK IN FRASERBUR ERBURG 838 HO HOUSEHO HOLDS LDS MIG G : UPGRAD GRADE E OF WATERN RNET ETWOR ORK IN SUTHERLA ERLAND 630 HOUSEHOL OLDS DS MIG G : CONSTR TRUCTION CTION OF RESERVOI OIR AT FRASERB RBUR URG G 838 HOUSEHOL OLDS DS MIG G : CONSTR TRUCTION CTION OF TWO RESERVOIRS IRS AT SUTHE HERLAND RLAND 630 HH HH DWA FUNDS: S: INVESTIG TIGATION TION FOR NEW BOREHO EHOLES ES AT WILLISTON ON (2013/20 2014) 4) R900 000 727 HOUSEHOLDS DS DWA ACIP FUNDS DS : TESTIN ING G AND EQUIP IPMENT MENT FOR THR HREE EXISTING TING BOREHOL EHOLES ES (2013/20 2014) 4) R 600 000 727 HOUSEHOLDS
FUNDS WERE PRIORITIZED IN THE DIFFERENT SECTORS AS FOLLOWS:
SANITATION ION
ERADICATION ON OF BUCKET ETS S IN WILLISTON ON, , FRASER ERBUR BURG G AND S SUTHER ERLAND ND (1100 00 HH)
CTION ON OF OXIDATION ON PONDS AT WILLISTON ON 727 HH HH
CONSTRUCT CTIO ION N OF OXIDATION ON PONDS AT SUTHER ERLAND ND 630 HH
PHASE I : C CONSTRUCT CTIO ION N OF NEW OXIDATION ON PONDS (FRASER ERBUR BURG) 628 HH
STILL TO BE IMPLEMENTED NTED AT THE OXIDATIO ION N PONDS 838 HH
ERADICATION ON OF UDS : LIFE SPAN WAS 8 YEARS, , IMPLEMENTED: NTED: 2004 1100 0 HH
STREET ETLIG LIGHTS HTS / HIGH MAST LIGHTING NG
G : HIGH MAST LIGHTS IN AMANDE DELBO BOOM OM AT WILLISTON ON 514 HH
G : STREET ET LIGHTS S IN FRASERBU ERBURG G AND SUTHERL RLAND AND 1042 HH
MIG DWA DoE Human Settlements District Municipality
CONDITION TAR ROAD, 70 KM GRAVEL ROAD )
20KM OF SEWERAGE PIPELINES)
TOWNS
THE ALLOCATION OF THE MIG FUNDING IS NOT ADEQUATE TO COMPLETE MOST OF THE PROJECTS IN ONE FINANCIAL YEAR. THIS LEAD TO APPLYING FOR ROLL OVER OF FUNDS AND THIS REFLECTS AS POOR SPENDING FOR THE PARTICULAR FINANCIAL YEAR
This project will be funded over a period of three financial years due to the allocation of MIG. BUDGET : Total amount for the above project is R 12 098 572,88 This project is ready to be implemented.
NETWORK (WILLISTON) This project is already submitted to MIG, but has not yet been approved by DWA due to the information/results that is still outstanding to complete the registration (RBIG)
IT’S OWN PMU
THE VARIOUS TECHNICAL SUPPORT IN EACH PROJECT
NOVEMBER 2013 AND HAS COMPLETED TWO PROJECTS FOR REGISTRATION.
ANNUALLY THE VARIOUS REPORTS AS REQUIRED.
REPORTS
AND MAINTENANCE
RDP
still be done
toilets.
cost and is not efficient to deliver an effective service (the demand is greater than the service that the municipality can provide)
10 km of tar road must be resealed and 70 km of gravel road must be paved Potholes will be repaired with EPWP funding and the gravel roads are graded. The current graders is in a poor condition and the maintenance cost is high and it is not possible to do maintenance on the gravel roads as much as it should be done The maintenance of the tar road is very costly due to the distance from the suppliers that the materials have to be brought in
All registered erven have an electrical connection Eskom receives the income for the service provided in Sutherland and in Amandelboom (Williston) High mast lights were installed in Amandelboom (Williston) and street lights in Fraserburg and Sutherland The infrastructure of Fraserburg is currently in a poor condition and is in need of urgent upgrading The infrastructure in Williston is in a good condition
INTEGRATED WASTE MANAGEMENT PLAN WASTE SERVICES AND RECYCLING INFRASTRUCTURE There is no WMO The IWMP has not been developed yet The IWMP is incorporated in the IDP There is no progress regarding the implementation of infrastructure as per IWMP There is no backlog regarding the collection of waste Currently there is no plan to implement waste separation DISPOSAL INFRASTRUCTURE Two of the 3 sites are not licensed Jobs in Waste Project is registered in the municipality at the landfill site in Williston There is no project registered with MIG regarding landfill sites
disciplines can be participated in
facilities