Ove rvie w o f T ranspo rtatio n F unding Optio ns fo r No rth - - PDF document
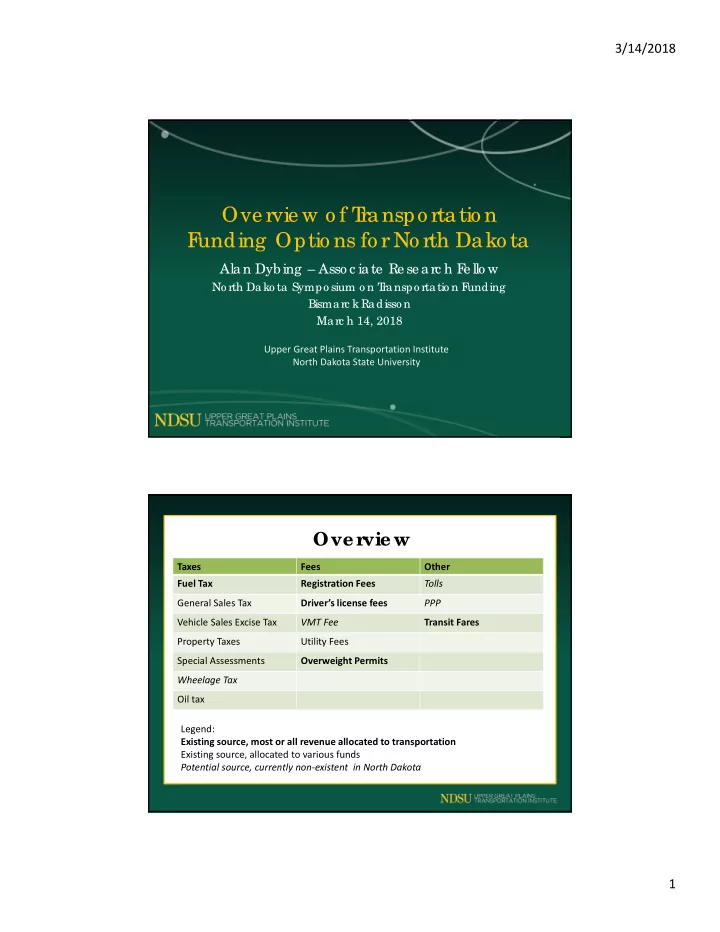
3/14/2018 Ove rvie w o f T ranspo rtatio n F unding Optio ns fo r No rth Dako ta Alan Dybing Asso c iate Re se arc h F e llo w No rth Dako ta Sympo sium o n T ranspo rtatio n F unding Bismarc k Radisso n Marc h 14, 2018 Upper Great
3/14/2018 2
Pr e se ntation F
- r
mat
ND and peer states
Current use in ND and seven peer states: MN, WI, SD, NE, IA, MT, ID
Description
Brief overview of the funding
- ption.
Viability
Assessment of the additional revenue that could be generated by the discussed option. Also, reflects
- n the implementation complexity
from the administrative perspective.
Sustainability
Responsiveness to higher fuel efficiency, changes in the global oil price, and alternative vehicle propel technologies (hybrid, electric).
F ue l T ax (state )
ND and peer states Description
Fixed per‐gallon rate tax collected at fuel racks. Not adjusted for inflation. Collected independently from the fixed federal tax ($0.184/gal).
Viability
High, currently generates $170 M in annual revenue. Current management and administration in place.
Sustainability
Vulnerable to higher fuel efficiency and emergence of alternative technologies.
ND $ 0.230 NE $ 0.293 MN $ 0.286 IA $ 0.305 SD $ 0.329 MT $ 0.315 WI $ 0.300 ID $ 0.330
3/14/2018 3
F ue l T ax (state )
- Additio nal pro je c tio ns o f future de c line
– Many studie s and pape rs have be e advanc e d in re c e nt ye ars. – Ve hic le MPG pro je c tio ns will impac t re ve nue
- T
e xas DOT study pro je c ts auto MPG to inc re ase to as high as 80 MPG by 2030 – c urre nt is 20 MPG
– Co nne c tic ut sanc tio ne d 2017 study c o nduc te d by CDM Smith
- Pro je c tio n – De c line in fue l sale s by 2040 ranging
fro m 34% to 45% de c re ase
- Pro je c tio ns – De c line in fue l tax re ve nue o f $20.8
billio n/ ye ar by 2025 (c o mbine d state & F e de ral)
F ue l T ax (state )
3/14/2018 4
F ue l T ax (state ) F ue l T ax (state )
- Additio nal pro je c tio ns o f future de c line
– I f go ve rnme nts want to still ge ne rate e quivale nt re ve nue to ke e p up with future trave l le ve ls, gas tax rate s will ne e d to be inc re ase d to as muc h at $1.16 pe r gallo n to
- ve rc o me the e ffe c t o f inc re asing fue l
e ffic ie nc y. (c urre nt c o mbine d fe de ral and state ave rage rate is $.45/ gal.
3/14/2018 5
F ue l sale s tax
ND and peer states
Not collected in ND and any of the peer states. Collected in several states across the U.S.
Description
Sales tax collected on fuel sales. Based on a percentage of the pre‐ tax fuel price.
Viability
High revenue potential. Depending on the adopted collection method, might require additional administrative resources.
Sustainability
Positively correlated with fuel
- prices. Higher fuel efficiency would
reduce the revenue.
Ge ne r al sale s tax
ND and peer states Description
General tax collected on sales of various goods and services, collected by the state and local jurisdictions. A portion of sales tax revenue could be allocated to transportation funds.
Viability
Reliable, strong revenue source. N.D. currently collects approx. $1.5 billion from sales tax.
Sustainability
Higher fuel prices could have some negative impact on consumer activity, reducing sales tax revenue.
State State Sales Tax Combined State and Local Tax (Average) ND 5.0% 6.78% MN 6.875% 7.3% WI 5.0% 5.42% SD 4.5% 6.39% NE 5.5% 6.89% IA 6.0% 6.8% MT None None ID 6.0% 6.03%
3/14/2018 6
Ve hic le sale s e xc ise tax
ND and peer states
.
Description
Sales tax collected on vehicle transactions.
Viability
Existing, well‐established revenue
- source. The car sales market in N.D.
exceeds $2 billion per year.
Sustainability
Long term higher fuel prices could result in reduced vehicle ownership, though the impact may be minimal.
State Tax Rate Transportation fund allocation ND 5.0% No – Not since 1970's & 10% in 2007 MN 6.5% Yes, min. 40% goes to transit, rest to the highway fund WI 5.0% No SD 4.0% Yes NE 5.5% Yes IA 5.0% Yes MT No tax No tax ID 6.0% No
Pr
- pe r
ty T axe s (mill le vie s)
ND and peer states
Varies on a jurisdictional level on a case‐ by‐case basis. State mills are insignificant (as in the case of ND) or do not exist at all. States typically do not collect property tax dedicated to infrastructure at the state level.
Description
Collected by all types of jurisdictions as a certain percent of the property’s taxable value.
Viability
High revenue potential, but use is limited primarily to local projects. Also, residents are sensitive to any tax increase.
Sustainability
No relationship with fuel economy and fuel prices.
3/14/2018 7
Spe c ial Asse ssme nts
ND and peer states
Authorized to use by all jurisdictions in ND and peer‐states. Specific formulas vary on a case‐by‐case basis.
Description
Additional taxes levied to fund a specific investment at the local level.
Viability
Local use only, limited revenue potential.
Sustainability
No relationship with fuel economy and fuel prices.
Utility F e e s
ND and peer states
Many cities in ND and peer states charge utility fees for streetlights and other minor maintenance expenses. No utility fees are collected for transportation infrastructure investments anywhere in the region.
Description
Fixed rate utility prices based upon number of residents, property type or property size.
Viability
Local use only, limited revenue potential. Easy to administer, but could raise significant opposition (flat fee collected independently of actual highway use and income).
Sustainability
No relationship with fuel economy and fuel prices.
3/14/2018 8
Whe e lage T ax
ND and peer states
Not in use anywhere in ND Used by selected jurisdictions across the peer states; e.g. in MN a $10‐20 tax is collected by 53 out of 87 counties.
Description
Per‐vehicle fee levied by local jurisdiction, similar to the state registration fee.
Viability
Moderate to high revenue potential, depends on vehicle ownership levels. Would require new administrative resources to implement and collect.
Sustainability
No relationship with fuel economy and fuel prices.
Oil T ax
ND and peer states Description
Tax charged on fossil fuels and other minerals extracted and/or processed within the state.
Viability
High revenue potential (currently N.D. collects approx. $1.5 billion/yr from oil tax). Existing revenue source, easy to administer.
Sustainability
Revenue is positively correlated with fuel price, opposite to many
- ther sources.
Tax rates ND 5% tax for oil, $.04/1,000 cu. ft. for gas, $0.4/ton for coal. MN $2.56 per ton for iron. No oil tax. WI 7% tax for oil, 3‐15% tax for metals SD 4.5% + 2.4 mills on all minerals NE 2‐3% tax for oil, 2% tax for uranium IA none MT 0.3% tax on oil, 3‐15% tax on coal ID 5 mills/bbl. of oil and 5 mills/50,000 cu. ft. of gas, additionally 2.5% oil production tax.
3/14/2018 9
Ve hic le R e gistr ation F e e s
ND and peer states Description
Per‐vehicle fee assessed annually on all vehicle. Currently based upon vehicle age and weight.
Viability
Well‐established funding source with high revenue ($85 million/yr).
Sustainability
Generally independent from fuel price changes and technology advancements (under current formula).
Car 4‐door sedan Open‐box 2‐door pickup 4‐door SUV Year 2017 2012 2007 Weight 3199 lb. 5500 lb. 6100 lb. $ initial $24,000 $29,000 $38,000 $ current $20,000 $12,000 $10,000 ND $73 $65 $117 MN $236 $71 $35 WI $75 $75 $75 SD $72 $108 $100 NE $342 $234 $99 IA $252 $312 $215 MT $217 $87 $28 ID $69 $57 $45
Hybr id/ E le c tr ic R e gistr ation F e e s
ND and peer states Description
Additional surcharge for hybrid/electric cars, assessed to recoup lower fuel tax revenues, reduced due to higher efficiency
Viability
Easy to implement, but has limited revenue potential. Only 1,200 hybrid/electric cars are currently registered in N.D.
Sustainability
Revenue would increase along with higher hybrid/electric vehicle
- wnership. Higher fuel prices might
stimulate that ownership.
State Hybrid or Electric Surcharge ND None MN $75 WI $75 hybrid, $100 electric SD None NE $75 IA None, electric vehicles pay a discounted $25 fee MT None ID $75 hybrid, $140 electric
3/14/2018 10
Dr ive r ’s lic e nse fe e s
ND and peer states Description
Periodic fee imposed on all licensed drivers when obtaining/renewing license.
Viability
Moderate: 550,000 drivers currently licensed in N.D., but the fee is low and collected only once every 4‐6
- years. Approx. annual revenue equal
to $4 million.
Sustainability
No relationship with fuel prices and vehicle technology.
State License Fee Duration of License Annual Average Fee ND $15 4‐6 years $2.50‐$3.75 MN $25.25 4 years $6.31 WI $34.00 8 years $4.25 SD $28.00 5 years $5.60 NE $21.50 4 years $5.38 IA $4/year 5‐8 years $4.00 MT $40.50 8 years $5.06 ID $30.00 4 years $7.50
VMT (Ve hic le -mile s-tr ave lle d) fe e
ND and peer states
VMT fee is widely discussed across the U.S. but so far has not been implemented anywhere. Several western states have been running pilot programs to examine VMT fee viability.
Description
Fee based on actual mileage travelled. Could be collected via periodical
- dometer readings or in‐vehicle
monitoring devices. Could vary based on road type, vehicle type, and other factors.
Viability
High, could exceed current fuel tax revenue and establish a more fair user fee collection scheme. However, implementation would be complex and could raise strong resistance due to privacy concerns.
Sustainability
Independent of fuel efficiency advancements and fuel prices.
3/14/2018 11
T
- lls
ND and peer states
No major tolled facility exists in N.D. and any of the peer states.
Description
User fees collected directly from drivers at toll booths and/or electronically. Could include portions of the highway system or specific facilities, e.g. bridges. Currently prohibited on interstates, but federal govt. leans towards removing that rule.
Viability
Variable revenue potential, depends on traffic volume, geographic range, availability of alternative routes. Would require significant resources to implement & enforce (up to 20% of revenue).
Sustainability
Mostly independent from fuel prices and vehicle technology advancements.
Public -Pr ivate Par tne r ships (PPP)
ND and peer states
In North Dakota, PPPs such as installation of traffic signals, construction of interchange ramps, pullout and acceleration lanes, and highway overlays have occurred in the recent
- past. Similar small scale projects have been
implemented in surrounding states.
Description
Infrastructure investment is paid for by a private entity in exchange for a guaranteed revenue (paid over time by the government and/or with fees collected from users) or services
Viability
PPPs could provide infrastructure on a local basis between private and government entities where a mutually beneficial transportation improvement could be implemented.
Sustainability
Mostly independent from fuel prices and increases in fuel efficiency.
3/14/2018 12
T r ansit F ar e s
ND and peer states
Fare levels in North Dakota are similar to those charged by peer agencies in neighboring states. Average fare is $1.50 per ride for in‐ town trips.
Description
Paid by transit riders when using the
- service. Could be paid per trip or by
purchasing passes.
Viability
Fare revenues cover 10‐15% of
- perating expense for urban