
SLIDE 1
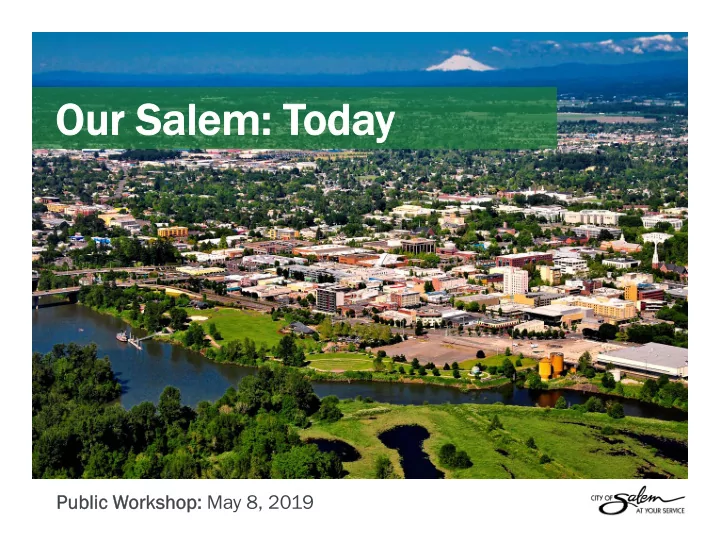
Our Salem: T Our Salem: Toda day
Public W Public Workshop: rkshop: May 8, 2019
Our Salem: T Our Salem: Toda day Public W Public Workshop: - - PowerPoint PPT Presentation
Our Salem: T Our Salem: Toda day Public W Public Workshop: rkshop: May 8, 2019 Meeting Agenda Pr Project U oject Updat date City Pr City Profil ofile Greenhouse Gas (GhG) In Greenhouse Gas (GhG) Invent ntor ory Draf
Public W Public Workshop: rkshop: May 8, 2019
Project U
date
City Profil
Greenhouse Gas (GhG) Invent ntor
Draft Scenarios and Indicat t Scenarios and Indicators rs
Report C Card rd
What do you think? u think?
rds a and Y Your Re Report C Card rd
Next St xt Steps eps
Questions and Answers ers
2
Com Comprehensiv rehensive plans… e plans…
stakeholders’ values and dreams
the city to guide future growth and development
3
4
Phase 1
Existing Conditions + Scenarios
Fall 2018 – Spring 2019 Fall 2018 – Spring 2019
Phase 2
Community Vision
Phase 3
Update Comp Plan
TBD TBD TBD TBD
Phase 1
Existing Conditions + Scenarios
Fall 2018 – Spring 2019
Phase 2
Community Vision
Phase 3
Update Comp Plan
TBD TBD
5
Review Existing Plans Develop Scenarios Report Card Report Back Choose Indicators
3 5
We are here!
4 1 2
1 2
6
7
8
Current Pop. Est. 2035 Pop.
9
10
11
12
13
the atmo sphe re , and is the primary c ause o f glo bal c limate (I PCC).
remo ved (sequestered) fro m the atmo sphere.
emissio ns and sequestratio n asso c iated with ac tivities that o c c ur within a c ity, c o unty, o r regio n.
allo ws jurisdic tio ns to trac k pro gress to ward emissio ns reduc tio n go als
Credit: PIXNIO Credit: Flickr / Sheila Sund
14
consumption of goods and services like cars, food, fuels, appliances and clothing.
DIRECT INDIRECT
16
17
Source: Salem Electric and Portland General Electric (2019)
18
Source: 2012-2016 American Community Survey (ACS) 5-Year Estimates
19
Note: Comparison inventory years vary (Eugene: 2015, Beaverton: 2013, Bend: 2016, Portland: 2008, Ashland: 2015, Milwaukie: 2016)
20
21
Credit: State of Oregon Greenhouse Gas Emissions Inventory (2018)
years of data (backward looking)
for setting emissions reductions targets
climate action plan
22
The indicators are:
23
measured on a map
data is available
Comprehensive Plan
24
“Result Areas”
25
26
27
The Future The Present
28
These are not alternative growth scenarios used for Visioning
29
Bo Both assume th assume current City policies current City policies
Scenario 1 Scenario 1: Current T Current Trends (Most Lik ends (Most Likely) ly)
Scenario 2 Scenario 2: Zoning Buildout (Maximum Density) : Zoning Buildout (Maximum Density)
30
Current Trends Zoning Buildout
31
Current Trends Zoning Buildout
32
Current Trends Zoning Buildout
1.
Affordability (Housing + ability (Housing + Transpo ansportation + En tation + Energy) gy) 2.
Housing Affordability ability 3.
Complet lete Neighborhoods Neighborhoods 4.
lk and Transit F ansit Friendliness iendliness 5.
Jobs/ bs/Housing B
lance 6.
Active T Transpor ansportation tation 7.
Bicycle and P cle and Pedestrian Use destrian Use 8.
erage Wage ge 9.
ee Canopy 10.
Emplo ploymen ment Mix Mix 11.
Access to Freq equent T uent Transit ansit 12.
Proximity t imity to Parks and T Parks and Trails ails 13.
nue-to-Cost Ratio
14.
Annual Level of l of Ser Service ice 15.
Proper
Tax R x Revenue nue 16.
affic/P c/Pedestrian Accidents destrian Accidents 17.
Infill Development/ lopment/ Rede development lopment 18.
Development in Slopes, lopment in Slopes, Floodplain and Riparian Areas Floodplain and Riparian Areas 19.
Greenhouse Gas Emissions Emissions 20.
Air Pollution R llution Reduction duction
Similar: Similar: Dif Different: erent:
34
New homes continue t w homes continue to be built on the edges be built on the edges
New jobs mirr w jobs mirror current jobs
Current policies remain in place place
Current Trends Zoning Buildout
More development in lopment in the Zoning Buildout the Zoning Buildout Scenario Scenario
Different types of de rent types of development lopment
Redeve velopment
Mixed use Do d use Downt wntown wn
pulation varies betw ries between scenarios (54,000 een scenarios (54,000
Direct impact on re pact on revenue, accidents, etc. nue, accidents, etc.
Less to do with where de do with where development occurs lopment occurs
36
37
We are mo are moving in the wr ving in the wrong direction.
Is this the right direction? Is this the right direction? We seem t seem to be heading in the right direction. be heading in the right direction. We are doing w are doing well in some areas, ll in some areas, doing less w doing less well in o ll in others, and hers, and we ha have q questions that w estions that we need the citizens help t need the citizens help to answ answer er.
38
Indicat Indicator shee r sheets f ts for each “R r each “Result Area” esult Area”
Having a good balance of housing and jobs is important for many reasons. Salem in general is has many jobs and will continue to in the future.
We seem seem to be be heading in the heading in the right directi right direction. n.
About a third of new housing development today is from recent infill or redevelopment. This will increase in the future and that aligns with existing policies that promote infill and redevelopment.
We seem seem to be be heading in the heading in the right directi right direction. n.
Trees provide environmental and quality-of-life benefits. We currently don’t meet our target of 23%.
We We a are m moving in the in the wr wrong
direction. direction.
Salem has adopted targets to increase walking and biking trips by 2020. We are not projected to meet our goal.
We We a are m moving in the in the wr wrong
direction. direction.
The percentage of households living within a half-mile
Will we need more parks in the future?
Is this the Is this the right right direction? direction?
A “complete neighborhood” means people live within walking distance of parks, schools, grocery stores, businesses, transit. Is this important for the future of Salem?
Is this the Is this the right right direction? direction?
45
the report card and indicator sheets
your thoughts with the staff and consultant team
comment form
do we we wa want S Salem to to gr grow and de and develop? lop?
What do we v value? lue?
What goals do we ha have?
How can w w can we im impr prove our e our community? community?
46
47
www.cityofsalem.net/Pages/our-salem.aspx
Public W Public Workshop: rkshop: May 8, 2019