Off-Cycle Emissions Examples: Random NOx Random NOx test points - - PowerPoint PPT Presentation

off cycle emissions examples
SMART_READER_LITE
LIVE PREVIEW

Off-Cycle Emissions Examples: Random NOx Random NOx test points - - PowerPoint PPT Presentation

Federal Environmental Agency (UBA), Berlin I 3.2 - Air Pollution Abatement and Energy Saving in the Transport Sector Off-Cycle Emissions Examples: Random NOx Random NOx test points test points HDV 100 80 LDV 60 40


slide-1
SLIDE 1

Federal Environmental Agency (UBA), Berlin I 3.2 - Air Pollution Abatement and Energy Saving in the Transport Sector GRPE Off-Cycle Working Group, 11 September 2003, Windsor, Canada

  • Fig. 1

Off-Cycle Emissions

Stefan Rodt Federal Environmental Agency, Berlin stefan.rodt@uba.de

Stockholm 28 April 1999 Slide: 21 Stockholm 28 April 1999 Slide: 21

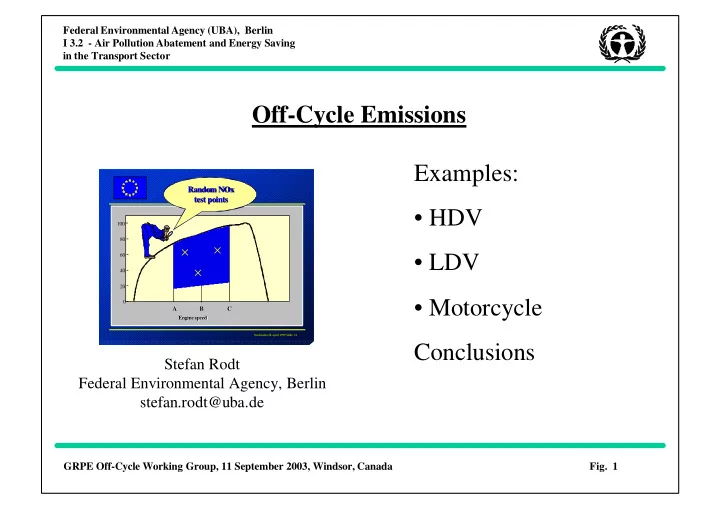
Engine speed Engine speed

A A B C C

20 40 60 80 100

× × ×

Random NOx Random NOx test points test points

Examples:

  • HDV
  • LDV
  • Motorcycle

Conclusions

slide-2
SLIDE 2

Federal Environmental Agency (UBA), Berlin I 3.2 - Air Pollution Abatement and Energy Saving in the Transport Sector GRPE Off-Cycle Working Group, 11 September 2003, Windsor, Canada

  • Fig. 2

Off cycle emissions from HDV EURO II compared to EURO I, excessive NOx emissions between test speeds EURO III compared to EURO II, excessive NOx emissions below control area (cycle bypass)

slide-3
SLIDE 3

Federal Environmental Agency (UBA), Berlin I 3.2 - Air Pollution Abatement and Energy Saving in the Transport Sector GRPE Off-Cycle Working Group, 11 September 2003, Windsor, Canada

  • Fig. 3

The European Approach (HDV engines, 1999/96/EC)

  • Non-homogeneous NOx map permitted in the control area
  • Linear interpolation of NOx random points prevents unreasonable

timing strategies within the control area

  • Transient particulates determined indirectly through load response test
  • For conventional diesel engines, gaseous emissions not determined under

transient conditions

  • Use of defeat device specifically prohibited in Euro 3 Directive
  • Reporting of AECD and defeat device may be requested, but not specified
  • Emissions refer to standard ambient conditions
  • OBD and in-service testing planned for Euro 4 (2005)

Source: EPA, WHDC SG/FE Meeting, Brussels, 28/02/2000

slide-4
SLIDE 4

Federal Environmental Agency (UBA), Berlin I 3.2 - Air Pollution Abatement and Energy Saving in the Transport Sector GRPE Off-Cycle Working Group, 11 September 2003, Windsor, Canada

  • Fig. 4

6.1.1. The use of a defeat device and/or irrational emissions control strategy is forbidden. If the type-approvalauthority suspects that a vehicle type utilises defeat device(s) and/or any irrational emission control strategy under certain operating conditions, upon request the manufacturer has to provide information on the operation and effect on emissions of the use of such devices and/or control strategy. Such information shall include a description of all emission control components, fuel control system logic including timing strategies and switch points during all modes of operation. These information should remain strictly confidential and not be attached to the documentation required in Annex I, section 3. 2.28. ‚Defeat Device means any element of engine or vehicle design which measures or senses vehicle speed, engine speed, gear used, temperature, intake pressure or any other parameter, with a view to activating, modulating delaying or deactivating the operation of any component of the emission control system so that the effectiveness of the emission control system is reduced under conditions encountered in normal vehicle use. Such a device will not be regarded as a defeat device if:

  • the need for the device is justified temporarily to protect the engine against intermittent operating

conditions that could lead to damage or failure and no other measures are applicable for the same purpose which do not reduce the effectiveness of the emission control system;

  • the device operates only when needed during engine starting and/or warming-up and no other

measures are applicable for the same purpose which do not reduce the effectiveness of the emission control system. DIRECTIVE 1999/96/EC OF THE EUROPEAN PARLIAMENT AND OF THE COUNCIL (HDV)

slide-5
SLIDE 5

Federal Environmental Agency (UBA), Berlin I 3.2 - Air Pollution Abatement and Energy Saving in the Transport Sector GRPE Off-Cycle Working Group, 11 September 2003, Windsor, Canada

  • Fig. 5

WHDC SG/FE 28/02/2000 11

CYCLE BYPASS PREVENTION

ELEMENTS OF THE EU PROCEDURE – NOx CONTROL PROCEDURE

  • Control area based on current EU driving patterns
  • NOx emission at the individual test modes can be adjusted according to the weighting

factors to meet the limit over the test cycle

  • Measured NOx emission at any point within the control area must not exceed by more than

10 % the corresponding values interpolated from the adjacent test modes as measured during the test run Speed A = nlo + 25 % (nhi - nlo ) Speed B = nlo + 50 % (nhi - nlo ) Speed C = nlo + 75 % (nhi - nlo) Engine Speed Idle A B C 20 40 60 80 100 Pmax 70% of Pmax 50% of Pmax Net Power [% of Net P max ] n lo n ref n hi Control Area

Source: EPA, WHDC SG/FE Meeting, Brussels, 28/02/2000

slide-6
SLIDE 6

Federal Environmental Agency (UBA), Berlin I 3.2 - Air Pollution Abatement and Energy Saving in the Transport Sector GRPE Off-Cycle Working Group, 11 September 2003, Windsor, Canada

  • Fig. 6

New findings on the emission factors of HDV in Europe

The emission factors were previously updated based on the measurement results for Euro 0 and Euro I engines according to the percentage limit value reductions

  • f the subsequent limit value stages Euro II to Euro V. More recent studies

indicate that the actual reduction rates of the new engine designs in actual

  • peration most likely remain far behind earlier assumptions. Electronic injection

systems in heavy-duty commercial vehicles – introduced as of the Euro II limit value – allow different injection strategies to be used in the various ranges of the engine map. Recent studies have shown that Euro II engines are deliberately

  • ptimised outside of the speeds driven in the type approval testing cycle to

improve the specific consumption (cycle bypass). In return, this leads to a considerable increase in nitrogen oxide emissions. The NOx emission factors for heavy-duty vehicles must therefore be corrected upward to a considerable degree.

slide-7
SLIDE 7

Federal Environmental Agency (UBA), Berlin I 3.2 - Air Pollution Abatement and Energy Saving in the Transport Sector GRPE Off-Cycle Working Group, 11 September 2003, Windsor, Canada

  • Fig. 7

load (%) 10 20 30 40 50 60 70 80 90 100 speed (rpm) 1200 1300 1400 1500 1600 1700 1800 1900 2000 2100 2200 2300

6.10 6 . 1 6.40 6.40 6 . 8 6.80 6 . 6.00 8 . 6.50 6.50 7 . 7.00 10.00 9.00

10.31 6.84 7.04 7.27 6.77 8.44 5.92 6.31 6.89 6.32 9.95 6.07 5.85 6.46 6.47 10.83 5.76 5.74 6.14 6.10 10.75 6.47 4.95 5.80 6.05 NOx (g/kWh) / Fz 4; Euro 1 load (%) 10 20 30 40 50 60 70 80 90 100 speed (rpm) 1200 1300 1400 1500 1600 1700 1800 1900 2000 2100 2200 2300

10.00 10.00 10.00 1 . 9.00 9.00 9.00 6.50 6 . 7.00 8.00 8 . 14.00 14.00 11.00 11.00 11.00 12.00 12.00 1 2 . 16.00 1 6 .

13.51 9.71 8.71 6.27 5.56 18.21 12.01 11.22 12.50 8.55 19.19 11.23 10.45 11.86 8.90 20.29 10.10 8.15 6.32 4.55 27.68 12.44 8.41 7.44 6.50 NOx (g/kWh) / Fz 11; Euro 2

Source: RWTÜV 2002

Heavy duty engines: comparison between EURO I and EURO II NOx engine maps of two consecutive engine types Test speeds

slide-8
SLIDE 8

Federal Environmental Agency (UBA), Berlin I 3.2 - Air Pollution Abatement and Energy Saving in the Transport Sector GRPE Off-Cycle Working Group, 11 September 2003, Windsor, Canada

  • Fig. 8

The average emission factors in g/km for NOx of HDV for the reference year 2003 are shown in the following table acoording to the handbook of emission factors HBEFA 1.2 and the new version HBEFA 2.0 (to be issued in autumn 2003) differenciated by emission classes.

Emission class HBEFA 1.2 in g/km HBEFA 2.0 in g/km Difference in % EURO I 6,18 7,12 +15,2% EURO II 6,3 8,99 +42,7% EURO III 4,5 7,5 +67%

slide-9
SLIDE 9

Federal Environmental Agency (UBA), Berlin I 3.2 - Air Pollution Abatement and Energy Saving in the Transport Sector GRPE Off-Cycle Working Group, 11 September 2003, Windsor, Canada

  • Fig. 9

Based on the updated emission factors the additional NOx emissions of HDV expressed in % are shown in the following table as a result of provisonal calculations (TREMOD/ Hausberger/ifeu). Although the share

  • f EURO II vehicles in annual HDV milage is only 13% in 2010 the

excessive NOx emissions amount to almost 50%, because the average emission factors are substantially higher not only for EURO II vehicles, but for EURO III vehicles as well, compared to earlier assumptions.

year 1995 1996 1997 1998 1999 2000 2001 2002 Exzessive NOx from HDV 19,2 % 20,4% 22,9% 25,2% 28,0% 30,6% 33,4% 36,9% year 2003 2004 2005 2006 2007 2008 2009 2010 Exzessive NOx from HDV 40,6% 44,1% 47,5% 49,7% 50,2% 50,1% 49,9% 49,5%

slide-10
SLIDE 10

Federal Environmental Agency (UBA), Berlin I 3.2 - Air Pollution Abatement and Energy Saving in the Transport Sector GRPE Off-Cycle Working Group, 11 September 2003, Windsor, Canada

  • Fig. 10

Stickstoffoxid-Emissionen der SNF in Deutschland

100,000 200,000 300,000 400,000 500,000 600,000 700,000 1995 1996 1997 1998 1999 2000 2001 2002 2003 2004 2005 2006 2007 2008 2009 2010 Year According to HBEFA 1.2 According to HBEFA 2.0 (provisional)

NOx emissions from HDV in Germany according to HBEFA 1.2 and HBEFA 2.0

slide-11
SLIDE 11

Federal Environmental Agency (UBA), Berlin I 3.2 - Air Pollution Abatement and Energy Saving in the Transport Sector GRPE Off-Cycle Working Group, 11 September 2003, Windsor, Canada

  • Fig. 11

200 400 600 800 1,000 1,200 1,400 1 9 8 1 9 8 2 1 9 8 4 1 9 8 6 1 9 8 8 1 9 9 1 9 9 2 1 9 9 4 1 9 9 6 1 9 9 8 2 2 2 2 4 2 6 2 8 2 1 2 1 2 2 1 4 2 1 6 2 1 8 2 2 Year NOx emissions [kt]/a

Other petrol vehicles Other diesel 1 vehicles

Petrol cars Diesel 1 cars

NOx emissions (kt/a) in Germany – TREMOD 2.0 (08/2000)

Diesel cars‘ share in total PC milage constant at 14 % from 2010

slide-12
SLIDE 12

Federal Environmental Agency (UBA), Berlin I 3.2 - Air Pollution Abatement and Energy Saving in the Transport Sector GRPE Off-Cycle Working Group, 11 September 2003, Windsor, Canada

  • Fig. 12

200 400 600 800 1,000 1,200 1,400 1 9 8 1 9 8 2 1 9 8 4 1 9 8 6 1 9 8 8 1 9 9 1 9 9 2 1 9 9 4 1 9 9 6 1 9 9 8 2 2 2 2 4 2 6 2 8 2 1 2 1 2 2 1 4 2 1 6 2 1 8 2 2 Year NOx emissions [kt]/a

Other petrol vehicles Other diesel 2 vehicles

Petrol cars Diesel 2 cars

NOx emissions (kt/a) in Germany – TREMOD 2.2 (03/2003)*

Diesel cars‘ share in total PC milage increases to 29 % by 2010 to 36 % by 2020 New emission factors for EURO II and EURO III HDV, + 115,000 t NOx

* Provisional calculations according to HBEFA 2.0

slide-13
SLIDE 13

Federal Environmental Agency (UBA), Berlin I 3.2 - Air Pollution Abatement and Energy Saving in the Transport Sector GRPE Off-Cycle Working Group, 11 September 2003, Windsor, Canada

  • Fig. 13

Normalized NOx map of a EURO III HDV engine Sharp increase of NOx emissions outside the control area at low speeds.

Quelle: Hausberger et al.

slide-14
SLIDE 14

Federal Environmental Agency (UBA), Berlin I 3.2 - Air Pollution Abatement and Energy Saving in the Transport Sector GRPE Off-Cycle Working Group, 11 September 2003, Windsor, Canada

  • Fig. 14

200 400 600 800 1000 1200 0,00% 20,00% 40,00% 60,00% 80,00% 100,00%

Engine-Load

EURO II/ 1628 rpm EURO III/ 1660 rpm

Comparison of a EURO II engine and a EURO III engine (both 162 kW) NOx emission versus load in the medium test speed range (1628/1660 rpm)

Prüfdrehzahlen [rpm] Euro II Euro III 650 612 1430 1450 1760 1800 2090 2150 Euro II Euro III 650 610 1500 1500 2400 2400 ESC ECE R 49

slide-15
SLIDE 15

Federal Environmental Agency (UBA), Berlin I 3.2 - Air Pollution Abatement and Energy Saving in the Transport Sector GRPE Off-Cycle Working Group, 11 September 2003, Windsor, Canada

  • Fig. 15

Comparison of a EURO II engine and a EURO III engine (both 162 kW) NOx emission outside test speed range (low speed, 1175/1195 rpm)

200 400 600 800 1000 1200 0,00% 20,00% 40,00% 60,00% 80,00% 100,00%

Engine-Load

EURO III/ 1195 rpm EURO II/ 1175 rpm

Prüfdrehzahlen [rpm] Euro II Euro III 650 612 1430 1450 1760 1800 2090 2150 Euro II Euro III 650 610 1500 1500 2400 2400 ESC ECE R 49

slide-16
SLIDE 16

Federal Environmental Agency (UBA), Berlin I 3.2 - Air Pollution Abatement and Energy Saving in the Transport Sector GRPE Off-Cycle Working Group, 11 September 2003, Windsor, Canada

  • Fig. 16

FTP

Real World vs. Lab Real World vs. Lab

Source: U.S. EPA ,October 21, 2002 U.S. EPA ,October 21, 2002

CO emissions of a HDV over vehicle speed and acceleration

slide-17
SLIDE 17

Federal Environmental Agency (UBA), Berlin I 3.2 - Air Pollution Abatement and Energy Saving in the Transport Sector GRPE Off-Cycle Working Group, 11 September 2003, Windsor, Canada

  • Fig. 17

FTP

Real World Real World vs vs Lab Lab

Source: U.S. EPA ,October 21, 2002 U.S. EPA ,October 21, 2002

CO emissions of a HDV over vehicle speed and acceleration

slide-18
SLIDE 18

Federal Environmental Agency (UBA), Berlin I 3.2 - Air Pollution Abatement and Energy Saving in the Transport Sector GRPE Off-Cycle Working Group, 11 September 2003, Windsor, Canada

  • Fig. 18

0% 10% 20% 30% 40% 50% 60% 70% 80% 90% 100%

  • 20%
  • 10%

0% 10% 20% 30% 40% 50% 60% 70% 80% 90% 100% n_norm normalised power 2.0%-2.5% 1.5%-2.0% 1.0%-1.5% 0.5%-1.0% 0.0%-0.5% european cycle, engine no. 31

0% 10% 20% 30% 40% 50% 60% 70% 80% 90% 100%

  • 20%
  • 10%

0% 10% 20% 30% 40% 50% 60% 70% 80% 90% 100% n_norm normalised power 2.0%-2.5% 1.5%-2.0% 1.0%-1.5% 0.5%-1.0% 0.0%-0.5% japanese cycle, engine

  • no. 31

0% 10% 20% 30% 40% 50% 60% 70% 80% 90% 100%

  • 20%
  • 10%

0% 10% 20% 30% 40% 50% 60% 70% 80% 90% 100% n_norm normalised power 2.0%-2.5% 1.5%-2.0% 1.0%-1.5% 0.5%-1.0% 0.0%-0.5% USA cycle, engine no. 31 0% 10% 20% 30% 40% 50% 60% 70% 80% 90% 100%

  • 20%
  • 10%

0% 10% 20% 30% 40% 50% 60% 70% 80% 90% 100% n_norm normalised power 2.0%-2.5% 1.5%-2.0% 1.0%-1.5% 0.5%-1.0% 0.0%-0.5% WHDC cycle, engine no. 31

Europe World Japan USA

Source: TÜV Automotive, 2000

Operatinp patterns of HDV in different parts of the world

slide-19
SLIDE 19

Federal Environmental Agency (UBA), Berlin I 3.2 - Air Pollution Abatement and Energy Saving in the Transport Sector GRPE Off-Cycle Working Group, 11 September 2003, Windsor, Canada

  • Fig. 19

Characteristics and Test Cycle Measuring Points of a HDV Engine

Source: EMPA, 01/2002

slide-20
SLIDE 20

Federal Environmental Agency (UBA), Berlin I 3.2 - Air Pollution Abatement and Energy Saving in the Transport Sector GRPE Off-Cycle Working Group, 11 September 2003, Windsor, Canada

  • Fig. 20

Characteristics and Test Cycle Measuring Points of a HDV Engine

Source: EMPA, 01/2002

slide-21
SLIDE 21

Federal Environmental Agency (UBA), Berlin I 3.2 - Air Pollution Abatement and Energy Saving in the Transport Sector GRPE Off-Cycle Working Group, 11 September 2003, Windsor, Canada

  • Fig. 21

The American Approach

  • Transient and steady-state determination of all regulated emissions through

use of FTP and supplemental test procedures (ESC, MAEL, NTE)

  • MAELs set for each point within the ESC control area for all regulated

emissions under transient and steady-state conditions

  • Non-homogeneity of all regulated emissions within the NTE zone limited to

the factor of 1.25 times the applicable FTP limit value

  • Compliance required under expanded ambient conditions and altitudes that

are typically encountered in-use

  • Use of defeat device specifically prohibited in US Federal Register
  • Reporting of AECD required
  • Guidance for reporting of AECD and determination of defeat device on the

basis of design screening thresholds

Source: EPA, WHDC SG/FE Meeting, Brussels, 28/02/2000

slide-22
SLIDE 22

Federal Environmental Agency (UBA), Berlin I 3.2 - Air Pollution Abatement and Energy Saving in the Transport Sector GRPE Off-Cycle Working Group, 11 September 2003, Windsor, Canada

  • Fig. 22

WHDC SG/FE 28/02/2000 15

CYCLE BYPASS PREVENTION

ELEMENTS OF THE USA PROCEDURE - NTE CONCEPT

  • Definition of a new control area (the "NTE" zone) that is broader than the ESC control area
  • Definition of specific emissions carve-out zones under low load operation
  • Each regulated emission must not exceed 1.25 times the FTP standard within the NTE

zone

  • NTE standards apply under any conditions of normal vehicle operation including steady

state and transient and expanded ambient conditions

Source: EPA, WHDC SG/FE Meeting, Brussels, 28/02/2000

slide-23
SLIDE 23

Federal Environmental Agency (UBA), Berlin I 3.2 - Air Pollution Abatement and Energy Saving in the Transport Sector GRPE Off-Cycle Working Group, 11 September 2003, Windsor, Canada

  • Fig. 23

Off cycle emissions from LDV, Passenger Cars Effects of ?-control deactivation at vehicle speeds above the maximum speed of the NEDC (120 km/h)

slide-24
SLIDE 24

Federal Environmental Agency (UBA), Berlin I 3.2 - Air Pollution Abatement and Energy Saving in the Transport Sector GRPE Off-Cycle Working Group, 11 September 2003, Windsor, Canada

  • Fig. 24

2.16. “Defeat device” means any element of design which senses temperature, vehicle speed, engine RPM, transmission gear, manifold vacuum or any other parameter for the purpose of activating, modulating, delaying or deactivating the operation of any part of the emission control system, that reduces the effectiveness of the emission control system under conditions which may reasonably be expected to be encountered in normal vehicle

  • peration and use. Such an element of design may not be considered a defeat device if:
  • I. the need for the device is justified in terms of protecting the engine against damage or accident and for safe
  • peration of the vehicle, or
  • II. the device does not function beyond the requirements of engine starting, or
  • III. conditions are substantially included in the Type I or Type VI test procedures.’

Section 5.1.1: The technical measures taken by the manufacturer must be such as to unsure that the tailpipe and evaporative emissions are effectively limited, pursuant to this Directive, throughout the normal life of the vehicle and under normal conditions of use. This will include the security of those hoses and their joints and connections, used within the emission control systems, which must be so constructed as to conform with the original design intent. For tailpipe emissions, these provisions are deemed to be met if the provisions of sections 5.3.1.4 (type-approval) and section 7 (conformity of production and in-service vehicles) respectively are complied with. The use of a defeat device is prohibited.

DIRECTIVE 98/69/EC OF THE EUROPEAN PARLIAMENT AND OF THE COUNCIL (LDV)

slide-25
SLIDE 25

Federal Environmental Agency (UBA), Berlin I 3.2 - Air Pollution Abatement and Energy Saving in the Transport Sector GRPE Off-Cycle Working Group, 11 September 2003, Windsor, Canada

  • Fig. 25

Quelle: Fa. META, 2000

Fuel consumption map of a SI PC engine and operating range in the NEDC Engine speed Engine load

slide-26
SLIDE 26

Federal Environmental Agency (UBA), Berlin I 3.2 - Air Pollution Abatement and Energy Saving in the Transport Sector GRPE Off-Cycle Working Group, 11 September 2003, Windsor, Canada

  • Fig. 26

Examples of car types with a small area of ?-control deactivation in the engine map

Maximale Last (als % der Volllast), bis zu der noch Lambda=1 geregelt wird, in Abhängigkeit von der Drehzahl (als % der Nenndrehzahl)

0% 10% 20% 30% 40% 50% 60% 70% 80% 90% 100% 0% 10% 20% 30% 40% 50% 60% 70% 80% 90% 100% % Nenndrehzahl % Last Mercedes A140 Mercedes C200 Opel Astra 1,6i Skoda Octavia 1,8i

Quelle: ROTOTEST 1999

Below the curves: map area ? = 1 Above the curves:: map area ? < 1

Engine load % Engine speed %

slide-27
SLIDE 27

Federal Environmental Agency (UBA), Berlin I 3.2 - Air Pollution Abatement and Energy Saving in the Transport Sector GRPE Off-Cycle Working Group, 11 September 2003, Windsor, Canada

  • Fig. 27

Maximale Last (als % der Volllast), bis zu der noch Lambda=1 geregelt wird, in Abhängigkeit von der Drehzahl (als % der Nenndrehzahl)

0% 10% 20% 30% 40% 50% 60% 70% 80% 90% 100% 0% 10% 20% 30% 40% 50% 60% 70% 80% 90% 100% % Nenndrehzahl % Last Citroen Berlingo 1,8 Mazda323F 1,8 Renault Laguna 1,6 Volvo S70 GLT

Quelle: ROTOTEST 1999

Examples of car types with a large area of ?-control deactivation in the engine map

Below the curves: map area ? = 1 Above the curves:: map area ? < 1

Engine load % Engine speed %

slide-28
SLIDE 28

Federal Environmental Agency (UBA), Berlin I 3.2 - Air Pollution Abatement and Energy Saving in the Transport Sector GRPE Off-Cycle Working Group, 11 September 2003, Windsor, Canada

  • Fig. 28

30 60 90 120 150 180 100 200 300 400 500 600 700 800 900 1000 Zeit (s) vmax<= 130km/h: 436s Meßzeit vmax<= 150km/h: 736s Meßzeit vmax> 150km/h: 1000s Meßzeit Phase 1 Phase 3 Phase 2

German Autobahn test cycle (used in the emission factors programme) Time in sec Speed km/h

slide-29
SLIDE 29

Federal Environmental Agency (UBA), Berlin I 3.2 - Air Pollution Abatement and Energy Saving in the Transport Sector GRPE Off-Cycle Working Group, 11 September 2003, Windsor, Canada

  • Fig. 29

0,0E+00 2,0E+05 4,0E+05 6,0E+05 8,0E+05 1,0E+06 1,2E+06 1 51 101 151 201 251 301 351 401 451 501 551 601 651 701 751 801 851 901 951 1001 Sekunden [s]

CO-Masse [mg]

40 80 120 160

Geschwindigkeit [km/h]

CO-DC200-kum CO-PTCruiser-Nr.304--kum Speed.SysComp.Dyno

Accumulated CO emissions over elapsed Autobahn cycle time DaimlerChrysler 200 (EURO 4) and PT Cruiser (EURO 3)

Quelle: RWTÜV, 2003

Elapsed cycle time in sec. Acc. CO mass in mg Cycle speed km/h

slide-30
SLIDE 30

Federal Environmental Agency (UBA), Berlin I 3.2 - Air Pollution Abatement and Energy Saving in the Transport Sector GRPE Off-Cycle Working Group, 11 September 2003, Windsor, Canada

  • Fig. 30
  • 500

500 1000 1500 2000 2500 3000 3500 4000 4500 5000 70 80 90 100 110 120 130 140 150 160 170 Geschwindigkeit in km/h CO-Emissionen in mg/km

A3 A3 A3 A6 A6 A6 Yaris Yaris Yaris Voyager Voyager Voyager

CO-Emission im Autobahnzyklus in Abhängigkeit von der Geschwindigkeit

Quelle: RWTÜV, Feldüberwachung

CO emission in the Autobahn test cycle over vehicle speed

Vehicle speed in km/h CO in mg/km

slide-31
SLIDE 31

Federal Environmental Agency (UBA), Berlin I 3.2 - Air Pollution Abatement and Energy Saving in the Transport Sector GRPE Off-Cycle Working Group, 11 September 2003, Windsor, Canada

  • Fig. 31

500 1000 1500 2000 2500 3000 3500 90 100 110 120 130 140 150 160 Geschwindigkeit [km/h] Honda Civic, EURO3 VW Golf EURO2, D4 VW LUPO EURO2, D4 Nissan Micra EURO2, D3 Daimler Chrysler A 140 EURO 2, D3

CO emission in the Autobahn test cycle over vehicle speed examples of cars with small engine capacity ( < 1.4 liters)

Vehicle speed in km/h CO in mg/s

slide-32
SLIDE 32

Federal Environmental Agency (UBA), Berlin I 3.2 - Air Pollution Abatement and Energy Saving in the Transport Sector GRPE Off-Cycle Working Group, 11 September 2003, Windsor, Canada

  • Fig. 32

200 400 600 800 1000 1200 1400 90 100 110 120 130 140 150 160 Geschwindigkeit [km/h] Renault Megane EURO2, D3 Mitsubishi Carisma GDI, EURO2, D3 Opel Omega EURO2, D4 Audi A6, EURO2, D3

CO emission in the Autobahn test cycle over vehicle speed examples of cars with medium engine capacity ( > 1.4 liters)

Vehicle speed in km/h CO in mg/s

slide-33
SLIDE 33

Federal Environmental Agency (UBA), Berlin I 3.2 - Air Pollution Abatement and Energy Saving in the Transport Sector GRPE Off-Cycle Working Group, 11 September 2003, Windsor, Canada

  • Fig. 33

5 10 15 20 25 30 35 90 100 110 120 130 140 150 160 Geschwindigkeit [km/h] Honda Civic, EURO3 VW Golf EURO2, D4 VW LUPO EURO2, D4 Nissan Micra EURO2, D3 Daimler Chrysler A 140 EURO 2, D3

HC emission in the Autobahn test cycle over vehicle speed examples of cars with small engine capacity ( < 1.4 liters)

Vehicle speed in km/h HC in mg/s

slide-34
SLIDE 34

Federal Environmental Agency (UBA), Berlin I 3.2 - Air Pollution Abatement and Energy Saving in the Transport Sector GRPE Off-Cycle Working Group, 11 September 2003, Windsor, Canada

  • Fig. 34

5 10 15 20 25 30 35 90 100 110 120 130 140 150 160 Geschwindigkeit [km/h] Renault Megane EURO2, D3 Mitsubishi Carisma GDI, EURO2, D3 Opel Omega EURO2, D4 Audi A6, EURO2, D3

HC emission in the Autobahn test cycle over vehicle speed examples of cars with medium engine capacity ( > 1.4 liters)

Vehicle speed in km/h HC in mg/s

slide-35
SLIDE 35

Federal Environmental Agency (UBA), Berlin I 3.2 - Air Pollution Abatement and Energy Saving in the Transport Sector GRPE Off-Cycle Working Group, 11 September 2003, Windsor, Canada

  • Fig. 35

Excessive off cycle emissions caused by ?-control deactivation in cars with

SI engines at speeds above 120 km/h related to total emissions from raod traffic in Germany: Provisional calculations: CO emissions: in the range of 8 % up to 36 % CO2 emissions: in the range of 0.15 % up to 1.1 % due to oxidation of excessive CO, (excessive CO2 caused by increased fuel consumption not yet quantified) HC emissions: in the range of 0.6 % up to 5 % Also to be considered, not yet quantified: Formation of Benzene and other unregulated pollutants Formation of particulates

slide-36
SLIDE 36

Federal Environmental Agency (UBA), Berlin I 3.2 - Air Pollution Abatement and Energy Saving in the Transport Sector GRPE Off-Cycle Working Group, 11 September 2003, Windsor, Canada

  • Fig. 36

5.000 10.000 15.000 20.000 25.000 30.000 35.000 100 200 300 400 500 600 700 800 900 1000 Sekunden [s] 20 40 60 80 100 120 140 160 180 VW LUPO TDI (Euro3D4, 3l) - kum VW PASSAT 1.9TDI mit Pumpe-Düse- Motor (EURO3) - kum Mercedes C200K (EURO 4) - kum Geschwindigkeitsverlauf

Kumulierte NOx-Emissionen und Geschwindigkeitsverlauf

Quelle: RWTÜV, 2003

Accumulated NOx emissions over elapsed Autobahn cycle time

Elapsed cycle time in sec. Elapsed cycle time in sec. Acc. NOx mass in mg Cycle speed km/h

slide-37
SLIDE 37

Federal Environmental Agency (UBA), Berlin I 3.2 - Air Pollution Abatement and Energy Saving in the Transport Sector GRPE Off-Cycle Working Group, 11 September 2003, Windsor, Canada

  • Fig. 37

Off cycle emissions from a motorcycle Switching of fuel injection and ignition control strategy, electronically identification of test conditions (Cycle beating)

slide-38
SLIDE 38

Federal Environmental Agency (UBA), Berlin I 3.2 - Air Pollution Abatement and Energy Saving in the Transport Sector GRPE Off-Cycle Working Group, 11 September 2003, Windsor, Canada

  • Fig. 38

Cumulative CO-Emissions with and w./o. Cycle Beating

(Motorcycle BMW F650) 50.000 100.000 150.000 200.000 250.000

50 100 150 200 250 300 350 400 450 500 550 600 650 700 750 800 850 900 950 1000 1050 1100 1150 1200 1250

Time [s]

CO-Emission [mg] 10 20 30 40 50 Speed [km/h]

CO (cum.) with Cycle Beating CO (cum.) without Cycle Beating Speed

Emission measurement

Source: RWTÜV, Essen, 2002

slide-39
SLIDE 39

Federal Environmental Agency (UBA), Berlin I 3.2 - Air Pollution Abatement and Energy Saving in the Transport Sector GRPE Off-Cycle Working Group, 11 September 2003, Windsor, Canada

  • Fig. 39

Cumulative HC-Emissions with and w./o. Cycle Beating

(Motorcycle BMW F650) 4.000 8.000 12.000 16.000

50 100 150 200 250 300 350 400 450 500 550 600 650 700 750 800 850 900 950 1000 1050 1100 1150 1200 1250

Time [s]

HC-Emission [mg] 10 20 30 40 50 Speed [km/h]

HC (cum.) with Cycle Beating HC (cum.) without Cycle Beating Speed

Emission measurement

Source: RWTÜV, Essen, 2002

slide-40
SLIDE 40

Federal Environmental Agency (UBA), Berlin I 3.2 - Air Pollution Abatement and Energy Saving in the Transport Sector GRPE Off-Cycle Working Group, 11 September 2003, Windsor, Canada

  • Fig. 40

Cumulative NOx-Emissions with and w./o. Cycle Beating

(Motorcycle BMW F650) 250 500 750 1.000

50 100 150 200 250 300 350 400 450 500 550 600 650 700 750 800 850 900 950 1000 1050 1100 1150 1200 1250

Time [s]

NOx-Emission [mg] 10 20 30 40 50 Speed [km/h]

NOx (cum.) with Cycle Beating NOx (cum.) without Cycle Beating

Speed

Emission measurement

Source: RWTÜV, Essen, 2002

slide-41
SLIDE 41

Federal Environmental Agency (UBA), Berlin I 3.2 - Air Pollution Abatement and Energy Saving in the Transport Sector GRPE Off-Cycle Working Group, 11 September 2003, Windsor, Canada

  • Fig. 41

Conclusions: How to get off cycle emissions under control ?

  • The political intention of updating emission legislation and reducing emission

standards always is to achieve a certain overall emission level.

  • The obligation of the industry is to comply with this intention, not to search for

quasi legal loop holes or freedom of interpretation in the regulation which increases emissions above the desired level.

  • Test cycles can never be perfect, neither regarding representativity for real life
  • peration nor regarding safety against cycle bypass or cycle beating. Any test

cycle or control area definition related to certain parameters of engine design has its weaknesses and can be bypassed or become oudated after some time due to further technical development.

slide-42
SLIDE 42

Federal Environmental Agency (UBA), Berlin I 3.2 - Air Pollution Abatement and Energy Saving in the Transport Sector GRPE Off-Cycle Working Group, 11 September 2003, Windsor, Canada

  • Fig. 42
  • Emission requirements therefor must not be limited to a test cycle and a

defined control area, but be extended to cover all possible operating conditions with not to exceed limits related to the basic emission standards. The engines

  • resp. vehicles must comply with emission requirements in any randomly

selected mode of operation under almost all ambient conditions which may

  • ccur in real life.
  • The definition of defeat devices as well as of irrational control strategy

becomes less important if a not to exceed concept and a clear definition of boundary conditions including ambient conditions etc. is in place. Exceptions have to be limited as far as possible.

  • At the stage of type approval the manufacturer has to provide full information
  • n the operation and effect on emissions of the use of any devices and/or

control strategy. Such information shall include a description of all emission control components, fuel control system logic including timing strategies and switch points during all modes of operation.

slide-43
SLIDE 43

Federal Environmental Agency (UBA), Berlin I 3.2 - Air Pollution Abatement and Energy Saving in the Transport Sector GRPE Off-Cycle Working Group, 11 September 2003, Windsor, Canada

  • Fig. 43
  • Since the type approval authorities will not be able to check this set of data in

full technical detail, the manufacturer in addition should be obliged to sign a declaration that he does not apply any defeat device or irrational control strategy which violates either the legal provisions or the basic intention of the regulation, and that the engine or vehicle type complies with the not to exceed emission requirements.

  • In use compliance testing is much more important than the type approval

procedure, which in last consequence could be reduced to a formal act of self

  • certification. In use compliance testing must be enabled to verify not to exceed

emission requirements in any randomly selected mode of operation. In return the effort for measurements at the type approval stage could be minimized.