
SLIDE 1
Johnson Consulting I I HPI Architecture
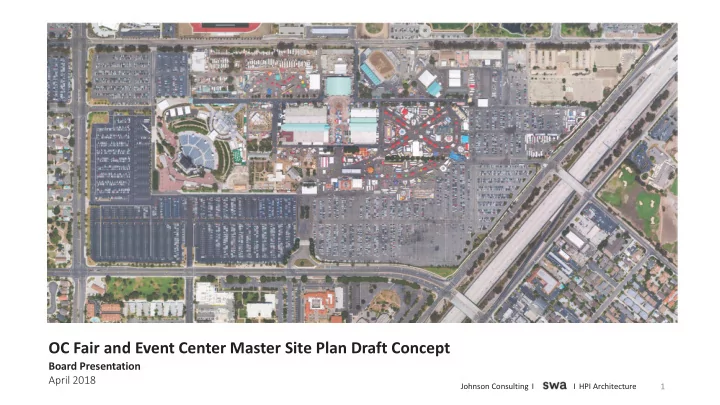
OC Fair and Event Center Master Site Plan Draft Concept
Board Presentation April 2018
1
OC Fair and Event Center Master Site Plan Draft Concept Board - - PowerPoint PPT Presentation
OC Fair and Event Center Master Site Plan Draft Concept Board Presentation April 2018 1 Johnson Consulting I I HPI Architecture 1. Existing Conditions Review 2 Johnson Consulting I I HPI Architecture 3 Johnson Consulting I I HPI
Johnson Consulting I I HPI Architecture
Board Presentation April 2018
1
Johnson Consulting I I HPI Architecture
2
Johnson Consulting I I HPI Architecture 3
Johnson Consulting I I HPI Architecture 4
Johnson Consulting I I HPI Architecture 5
Johnson Consulting I I HPI Architecture 6
Johnson Consulting I I HPI Architecture 7
Johnson Consulting I I HPI Architecture 8
Johnson Consulting I I HPI Architecture 9
Johnson Consulting I I HPI Architecture 10
Johnson Consulting I I HPI Architecture 11
Johnson Consulting I I HPI Architecture 12
Johnson Consulting I I HPI Architecture
13
Johnson Consulting I I HPI Architecture
14
Johnson Consulting I I HPI Architecture
15
Johnson Consulting I I HPI Architecture
16
Johnson Consulting I I HPI Architecture
17
2016 2017 Actual Actual Revenues Annual Fair Admissions to Grounds 10,492,464 $ 11,079,220 $ Commercial Space Rental Revenue 1,480,745 1,366,431 Carnival and Concessions Revenue 11,719,719 12,042,852 Exhibits Revenue 101,219 105,332 Attractions Revenue 5,188,971 5,581,490 Miscellaneous Revenue 5,220,059 4,899,724 Total Summer Fair Revenue 34,203,177 $ 35,075,049 $ Year-Round Rental of Facilities 3,531,742 $ 3,439,026 $ Other Event Revenue 5,685,654 6,576,411 Equestrian Center Revenue 117,864 144,345 Other Operating Revenue 232,064 433,216 Total Year-Round Revenue 9,567,324 $ 10,592,998 $ Non-Operating Revenues Interest Earnings 190,893 $ 374,189 $ Grants 8,970 159,423 Other Non-Operating Revenue 112,500 4,125 Prior Year Revenue 2,191 12,794 Total Non-Operating Revenue 314,554 $ 550,531 $ Total Revenue 44,085,055 $ 46,218,578 $
OCFEC Revenue and Expenses Statement (2015-2016)
2016 2017 Actual Actual Expenses Operating Expenses Payroll and Related Expense 13,701,737 $ 14,898,921 $ Professional Services Expense 3,389,566 4,812,505 Directors Expense 18,537 24,034 Insurance Expense 297,267 266,187 Telephone & Postage Expense 182,300 196,875 Supplies and Equipment Expense 3,764,114 3,897,345 Facility and Related Expense 3,686,838 4,130,716 Publicity & Related Expense 2,098,194 2,223,202 Attractions Expense 4,666,801 4,834,349 Other Self-Prod Event Expense 302,200 278,484 Premium Expense 117,664 112,271 Other Operating Expense 688,062 609,230 Total Operating Expense 32,913,280 $ 36,284,119 $ Non-Operating Expenses Depreciation Expense 3,145,163 $ 3,279,919 $ Major Projects 420,165 774,194 Net Pension Adjustment (59,545) (930,051) Prior Year Expense 31,909 114,517 Total Non-Operating Expense 3,537,692 $ 3,238,579 $ Total Expense 36,450,972 $ 39,522,698 $ Net Proceeds 7,634,083 $ 6,695,880 $
Source: OCFEC, Johnson Consulting
OCFEC Revenue and Expenses Statement (2015-2016)
Johnson Consulting I I HPI Architecture
18
Johnson Consulting I I HPI Architecture
19
Johnson Consulting I I HPI Architecture
20
January 26 OCFEC Board Workshop March 14 OCFEC Staff April 17 On-Grounds Partners May 17 Facility Users June 2 Community Partners June 5 Community Neighbors
OCFEC Mission Statement: Celebration of Orange County’s Communities, Interests, Agriculture and Heritage
Johnson Consulting I I HPI Architecture
21
Johnson Consulting I I HPI Architecture
22
Johnson Consulting I I HPI Architecture
23
Johnson Consulting I I HPI Architecture
24
Johnson Consulting I I HPI Architecture
25
Johnson Consulting I I HPI Architecture
26
Johnson Consulting I I HPI Architecture
27
Revenue = $9.0 M; Expenses = $8.5 M; NOI = $500K
Johnson Consulting I I HPI Architecture
28 Del Mar Fairgrounds
Summary of Exhibit and Meeting Space Size (SF) Capacity (# of Persons) Individual (Smallest) Combined (Largest) Theater Classroom Banquet Exhibits (#
Exhibit Halls O'Brien Hall 68,680
4,100
Exhibit Halls 55,200
3,300
Bing Crosby Hall 31,900
2,200
Wyland Center 30,800
800
Activity Center 19,800
1,300
Mission Tower 13,000
Subtotal Exhibit Hall SF 219,380 Meeting Rooms Number of Rooms 19
420*
10
300
20,116 Total 239,496
* One of 15 'Luxury Suites'. Source: Del Mar Fairgrounds, Johnson Consulting
Johnson Consulting I I HPI Architecture
29
Fairplex
Summary of Exhibit and Meeting Space Size (SF) Capacity (# of Persons) Individual (Smallest) Combined (Largest) Theater Classroom Banquet Exhibit Halls Expo Hall 4 105,500
6,896 8,333 Expo Hall 5 33,600
2,068 2,500 Expo Hall 6 33,600
2,068 2,500 Expo Hall 7 33,600
2,068 2,500 Exposition Center 33,600
1,300
41,120
2,758 3,333 Expo Hall 10 30,800
2,068 2,500 Total 311,820
Source: Fairplex, Johnson Consulting
Center: On-grounds, 244 rooms + 11,000 SF of meeting space.
rental.
Centers at Fairplex and Fairplex Child Development Center
Johnson Consulting I I HPI Architecture
30
Fairplex - Ponoma, CA
Total Revenues by Business Unit (2015) 2015 LA County Fair $27,690,537 Fairplex Year-round Events $10,837,675 Sheraton Fairplex Hotel & Conference Center $17,358,893 Barrets Equine Limited $2,449,504 Cornucopia Foods LLC $11,600,720 RV Park and Other $4,064,046 Total Operating Revenues $74,001,375
Source: Fairplex - Ponoma, CA, Johnson Consulting
LA County Fair (1.3 M visitors) + 300 events
Johnson Consulting I I HPI Architecture
31
Oklahoma State Fair Park
Summary of Event Spaces Size (SF) Exhibit Halls Bennett Event Center 201,000 The Pavilion 70,000 Oklahoma Expo Hall 47,022 Centennial Building 28,800 Modern Living Building 36,750 Hobbies, Arts & Crafts Building 19,600 Total Exhibit Halls 403,172 Other Event Spaces Animal Barns 9 Buildings Jim Norick Arena* 8,000-seats RV Park 330 spaces
*Also includes multiple meeting rooms Source: Oklahoma State Fair Park, Johnson Consulting Oklahoma State Fair, Inc.
Revenue & Expense Statement (2016) ($'000s) 2016 Revenues Admissions $3,816 Concessions 1,217 Entry Fees 5,315 Rental Income 6,788 Gifts and Grants 442 Fair Park and Related Events 1,425 State Fair 50 Corporate Sponsors 667 Other 598 Total Revenues $20,318 Total Operating Expenses $18,946 Total Operating Income (Loss) $1,372
Source: Oklahoma State Fair, Inc., Johnson Consulting
Johnson Consulting I I HPI Architecture
32
Kentucky Exposition Center
Summary of Exhibit and Meeting Space Size (SF) Capacity (# of Persons) Individual (Smallest) Combined (Largest) Theater Classroom Banquet Exhibits (#
Exhibit Halls West Wing
5,400 5,400 5,400 1,050 West Hall A
2,400 1,213 1,213 98 West Hall B
1,200 934 934 75 Pavilion
1,800 1,800 1,800 381 North Wing
5,400 5,400 5,400 1,205 East Hall A
1,400 1,213 1,213 98 East Hall B
1,200 934 934 75 South Wing A
14,109 8,666 8,666 700 South Wing B
14,109 8,666 8,666 700 South Wing C
10,860 10,860 10,860 875 Subtotal Exhibit Hall SF 957,518 Meeting Rooms Number of Rooms 54
590
40 40
665 310 310
70,000 Arenas/ Amphitheaters Freedom Hall
183 events; 1.7 M visitors
Johnson Consulting I I HPI Architecture
33
Revenues = $38 M; Profit = $3.5 M
Johnson Consulting I I HPI Architecture
34
Johnson Consulting I I HPI Architecture
35
Johnson Consulting I I HPI Architecture
36
Johnson Consulting I I HPI Architecture
37
Johnson Consulting I I HPI Architecture 38
Johnson Consulting I I HPI Architecture 39
PHASE I COST: $22,913,371
Johnson Consulting I I HPI Architecture 40
PHASE II COST: $21,861,024
Johnson Consulting I I HPI Architecture 41
PHASE III COST: $16,116,301
Johnson Consulting I I HPI Architecture 42
PHASE IV COST: $27,440,630
Johnson Consulting I I HPI Architecture 43
PHASE VI COST: $9,400,426
Johnson Consulting I I HPI Architecture 44
PHASE VI COST: $50,818,455
Johnson Consulting I I HPI Architecture 45
PHASE VII COST: $20,588,569
Johnson Consulting I I HPI Architecture 46
Johnson Consulting I I HPI Architecture 47
Johnson Consulting I I HPI Architecture 48
Johnson Consulting I I HPI Architecture 49
Johnson Consulting I I HPI Architecture
50
Johnson Consulting I I HPI Architecture
51
Johnson Consulting I I HPI Architecture
52
Johnson Consulting I I HPI Architecture
53
Johnson Consulting I I HPI Architecture
54
2017 Actual Program Elements New Construction/ Renovation (SF) 15,000 32,950 1,900 34,300
220,500 Demolition (SF)
36,900 8,790
525 634
307 Revenues Miscellaneous Revenue $4,899,724 $4,978,474 $4,994,824 $4,899,724 $4,899,724 $4,899,724 $4,899,724 $4,945,774
Includes rental of additional parking spaces at $10 for days during Fair
Rental of Facilities 3,439,026 3,439,026 3,439,026 3,307,026 4,306,082 3,439,026 3,439,026 3,439,026
In Phase 4 assumes 16 incremental Amphitheater events per year at $54,191 average profit
Total Revenue $43,672,004 $46,297,328 $46,313,678 $46,086,578 $47,085,634 $46,218,578 $46,218,578 $46,264,628 Expenses Payroll and Related Expense $14,898,921 $14,898,921 $14,898,921 $14,898,921 $14,898,921 $14,898,921 $14,898,921 $14,978,921
In Phase 7 assumes 2 additional staff
Facility and Related Expense 4,130,716 4,163,116 4,130,716 4,055,116 4,130,716 4,130,716 3,970,756 4,622,346
Assumes $2.16 per SF in incremental space**; Savings from demolition; in Phase 6 $0.20 pkw h saving from solar energy; in Phase 7 Assumes increase utilities at parking garage, plus $50 maintance reserve per space****
Depreciation Expense 3,279,919 3,469,534 3,465,418 3,308,797 3,541,052 3,279,919 3,311,073 3,778,527
Assumes depreciation rate of 2.6% per annum***
Total Expense $38,226,790 $39,744,713 $39,708,197 $39,475,976 $39,783,831 $39,522,698 $39,393,892 $40,592,936
* Non-inflated dollars ** Source: Building Owners and Managers Association International (BOMA) *** Source: IRS - useful life of non-residential buildings is 39 years; Depreciation calculated at value x 2.6% **** Source: Carl Walker Inc, national parking consultant and research publisher Source: OCFEC, Johnson Consulting, HPI, SWA
OCFEC Current and Projected Revenue and Expenses Statement - Affected Line Items Only*
Phase 1 Phase 2 Phase 3 Phase 4 Phase 5 Notes Phase 6 Phase 7
Johnson Consulting I I HPI Architecture
55
Phase Cash on Hand* Earnings (Profit)** Capital Expenditure (Budget) MSP Expenditure Balance 2017 $46.2 $6.7 ($9.3)
2018 $43.6 $4.0 ($2.5)
2019 $45.1 $4.0 ($2.0)
2020 Phase 1 $47.2 $6.6 ($2.0) ($22.8) $28.9 2021 $28.9 $6.6 ($2.0)
2022 Phase 2 $33.5 $6.6 ($2.0) ($21.9) $16.2 2023 $16.2 $6.6 ($2.0)
2024 Phase 3 $20.8 $6.6 ($2.0) ($16.1) $9.3 2025 $9.3 $6.6 ($2.0)
2026 Phase 4 $13.4 $7.3 ($2.0) ($20.6) ($2.3) 2027 ($2.3) $5.7 ($2.0)
2028 Phase 5 $0.8 $6.7 ($2.0) ($9.4) ($4.4) 2029 ($4.4) $6.7 ($2.0)
2030 Phase 6 ($0.2) $6.8 ($2.0) ($50.8) ($46.7) 2030 ($46.7) $6.8 ($2.0)
2031 Phase 7 ($42.4) $5.7 ($2.0) ($27.4) ($66.6)
* Revenues based on 2017 Actuals; Carries forward from 2018 onwards ** 2017 Actual; 2018 Budget; Carries forward Source: OCFEC, Johnson Consulting, HPI, SWA
OCFEC Balance Sheet ($M)
Johnson Consulting I I HPI Architecture
56
Johnson Consulting I I HPI Architecture 57