OBJECTIVE PARTICIPANTS to evaluate the effects of: Women who had - - PDF document

objective
SMART_READER_LITE
LIVE PREVIEW

OBJECTIVE PARTICIPANTS to evaluate the effects of: Women who had - - PDF document

with thanks to. The EMPOWIR STUDY TEAM Results of the EMPOWIR STUDY ( E nhance the M etabolic P rofile of W omen with Insulin R esistance) NAMS MEETING ME ME and OCTOBER 2018 Philipp Scherer PhD Feras M. Hantash MS PhD Director,


slide-1
SLIDE 1

NAMS MEETING OCTOBER 2018

RUTH FREEMAN MD ALBERT EINSTEIN COLLEGE OF MEDICINE/ MONTEFIORE HOSPITAL

ME ME

Results of the ‘EMPOWIR’ STUDY

(Enhance the Metabolic Profile of Women with Insulin Resistance)
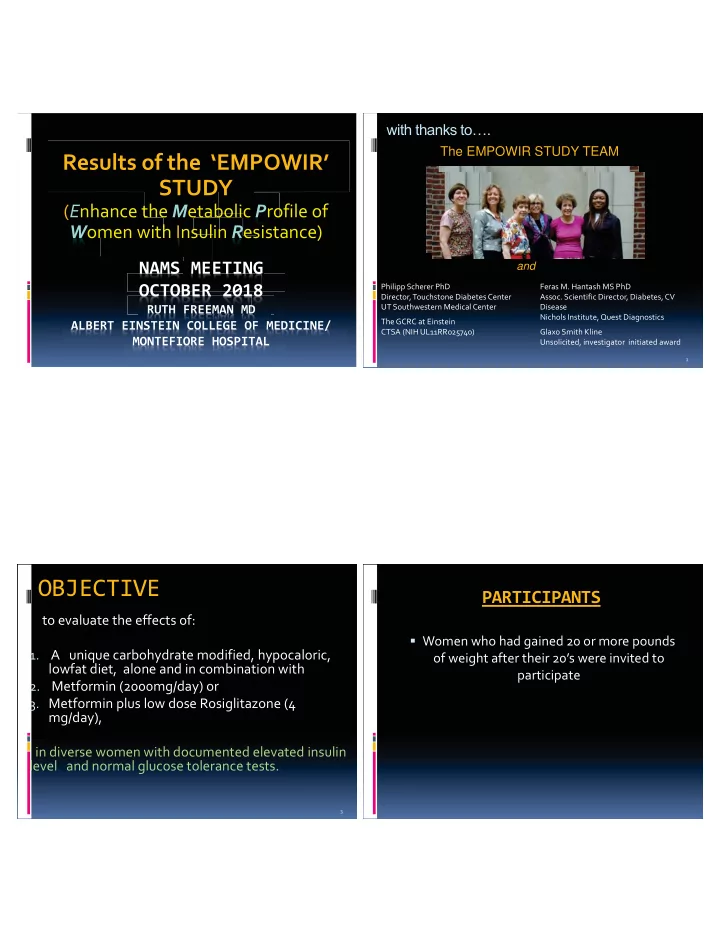
with thanks to….

2

The EMPOWIR STUDY TEAM

and

Philipp Scherer PhD Director, Touchstone Diabetes Center UT Southwestern Medical Center The GCRC at Einstein CTSA (NIH UL11RR025740) Feras M. Hantash MS PhD

  • Assoc. Scientific Director, Diabetes, CV

Disease Nichols Institute, Quest Diagnostics Glaxo Smith Kline Unsolicited, investigator initiated award

OBJECTIVE

to evaluate the effects of:

  • 1. A unique carbohydrate modified, hypocaloric,

lowfat diet, alone and in combination with

  • 2. Metformin (2000mg/day) or
  • 3. Metformin plus low dose Rosiglitazone (4

mg/day), in diverse women with documented elevated insulin level and normal glucose tolerance tests.

3

PARTICIPANTS

Women who had gained 20 or more pounds

  • f weight after their 20’s were invited to

participate

slide-2
SLIDE 2

Participant Flowchart

5

68 included-completed nutrition workshop 22 did not continue: 2 moved 1 pregnant 41 excluded: 24 normal 11 IFG, IGT or both 4 diabetic 2 incomplete data 346 excluded (age, BMI) 109 participants assessed with GTT 455 Participants assessed for eligibility*

46 participants 24 white, 10 Afr-American, 6 Hisp, 2 Asian, 4 “other” randomized 44 included in analysis

2 were excluded: 1 with GHD 1 on high dose steroids

* 11/07 to 12/10

Prevalence of abnormal glucose on Glucose tolerance test.

Number

(109)

Percent

Normal

23

21.1

Nl Glucose + high Insulin (AUC >100) 67

61.5

IFG or IGT

11

10.1

DM 4

3.7

Missing data 4

3.7

THE EMPOWIR DIET

Exchange program (40% carbs-40% protein-20% fat) total daily caloric intake ~ 1200-1500 elimination of all simple (free) sugars hallmark postponement of 3 allowable additional

daily carbohydrate servings (starches) to 4 PM

easily implemented: measure fats; estimate

carbohydrate and protein servings based on visual cues

7

THE EMPOWIR DIET

www.Syndromew.com

8

slide-3
SLIDE 3

Placebo Metformin Metformin plus Rosiglitazone

Baseline (se) 6 months (se) Mean Difference

(P value)

Baseline (se) 6 months (se) Mean Difference

(P value)

Baseline (se) 6months (se) Mean Difference

(P value) Weight (lbs) 185.4 (6.2) 176.2 (6.2)

  • 9.3

(0.049) 187.5 (5.2) 177.2 (4.7)

  • 10.3

(0.002) 180.3 (7.0) 170.8 (8.7)

  • 9.4

(0.032) Waist (Inches) 39.3 (0.6) 36.7 (0.9)

  • 2.6

(0.002) 36.6 (0.7) 35.6 (0.8)

  • 1.0

(0.143) 36.5 (0.9) 34.3 (1.4)

  • 2.2

(0.036) Systolic BP (mm Hg) 117.5 (2.9) 113.8 (2.9)

  • 3.6

(0.265) 114.3 (3.4) 107.2 (3.0)

  • 7.2

(0.001) 118.7 (6.0) 114.2 (4.7)

  • 4.5

(0.389) Diastolic BP (mm Hg) 75.9 (2.6) 71.7 (2.3)

  • 4.2

(0.025) 75.3 (2.0) 72.7 (2.3)

  • 2.5

(0.162) 76.9 (4.2) 74.3 (3.8)

  • 2.6

(0.562)

Mean differences BW, WC, and BP by study group

10

Mean differences in metabolic parameters

11

Placebo Metformin Metformin plus Rosiglitazone

Baseline (se) 6 months (se) Mean Difference (P value) Baseline (se) 6 months (se) Mean Difference (P value) Baseline (se) 6 months (se) Mean Difference (P value)

Fasting Glucose (mg/dl) 88.8 (1.3) 84.9 (2.2)

  • 3.8

(0.150) 89.9 (2.3) 84.0 (1.8)

  • 5.9

(0.034) 83.9 (2.4) 80.8 (1.4)

  • 3.1

(0.308) Fasting Insulin (μU/ml) 11.2 (1.4) 8.1 (1.3)

  • 3.1

(0.181) 12.5 (2.0) 8.0 (1.2)

  • 4.5

(0.026) 8.7 (1.5) 6.3 (0.9)

  • 2.4

(0.063) HbA1c (%) 5.4 (0.1) 5.3 (0.1)

  • 0.1

(0.309) 5.4 (0.1) 5.3 (0.1) (0.631) 5.4 (0.1) 5.4 (0.1) (0.645) HOMA -R 2.3 (0.2) 1.5 (0.)

  • 0.8

(0.142) 2.5 (.4) 1.6 (.3)

  • 0.9

(0.054) 1.9 (.3) 1.3 (0.2)

  • 0.6

(0.013) Adiponect in (μg/ml) 9.3 (1.3) 10.6 (1.2) 1.3 (0.092) 10.6 (1.4) 10.9 (1.7) 0.3 (0.730) 11.1 (1.0) 18.5 (1.5) 7.4 (<0.001)

Mean differences in lipid profile

12

Placebo Metformin

Metformin plus Rosiglitazone

Baseline 6 months Mean Difference (P value) Baseline 6 months Mean Difference (P value) Baseline 6 months Mean Difference (P value)

Total cholesterol (mg/dl) 176.1 (5.3) 183.6 (7.0) 7.5 (0.360) 190.3 (7.5) 202.0 (7.0) 11.8 (0.206) 204.6 (12.0) 224.2 (12.6) 19.7 (0.030) HDL (mg/dl) 49.3 (2.3) 56.5 (3.5) 7.2 (0.016) 61.6 (5.8) 70.1 (5.8) 8.5 (0.030) 57.7 (3.2) 68.3 (6.2) 8.2 (0.150) LDL (mg/dl) 105.6 (5.0) 108.1 (5.6) 2.5 (0.602) 111.2 (7.9) 111.3 (6.5) 0.1 (0.991) 126.6 (10.1) 132.1 (8.8) 6.0 (0.373) Triglycerides (mg/dl) 96.0 (10.1) 97.1 (11.7) 0.52 (0.648) 88.0 (11.3) 103.1 (13.0) 15.1 (0.094) 88.3 (11.9) 112.4 (20.5) 24.2 (0.103)

slide-4
SLIDE 4

Changes in body weight and leptin in 15 subjects with progressive weight loss at 3 major study intervals*

13

Body weight (kg) Leptin (ng/ml) Randomization visit (mean±SE) 80.16 ±2.15 26.15 ± 2.01 6 month 77.51 ± 2.21 25.99 ± 2.61 12 month 76.14 ± 1.75 27.57 ± 2.65 Mean difference1

  • 2.65 ± 1.00
  • 0.17 ± 1.40

P value - 6 months1 0.019 0.907 Mean difference2

  • 3.23 ± 1.12

1.39 ± 0.99 P value - 12 months2 0.013 0.183 Mean difference3

  • 0.2078 ± 0.6138

1.58 ± 1.31 P value - 6mos vs.12 mos.3 0.740 0.249

  • 1. Randomization vs. 6 month visit
  • 2. Randomization vs. 12 month visit
  • 3. 6 month vs. 12 month visit

* N Engl J Med 366;4 , Jan 26,2012 (letter)

Ghrelin Results in 22 subjects.

Ethnicity

32% caucasian, 41% African American 18% Hispanic 9% other Age 46.2

BMI 31.1 Ghrelin at baseline - 1392(113.8) pg/ml 6months – 1149 (75) P 0.031 reduction in 20/22 subjects.

Adiponectin results

Group Baseline 6 months P value

Placebo

9.3 (1.3) 10.6(1.2) 0.092

Metformin

10.6 (1.4) 10.9 (1.7) 0.730

Metformin + rosiglitazone

11.1 (1.0) 18.5 (1.5) 0.001 SUMMARY HYPOTHESIS SUMMARY HYPOTHESIS EErrError Bars: 95% CI

slide-5
SLIDE 5

EErrError Bars: 95% CI EErrError Bars: 95% CI

Conclusion

  • 1. Weight gain in adult women is often

associated with insulin resistance

  • 2. Fasting insulin was reduced after 6 months
  • n dietary intervention and metformin
  • 3. A modified diet with delayed CHO intake

can result in significant wgt reduction

  • 4. Leptin did not fall in this wgt loss study
  • 5. Ghrelin was reduced
  • 6. Adiponectin was reduced only in met-rosi

group