
SLIDE 1
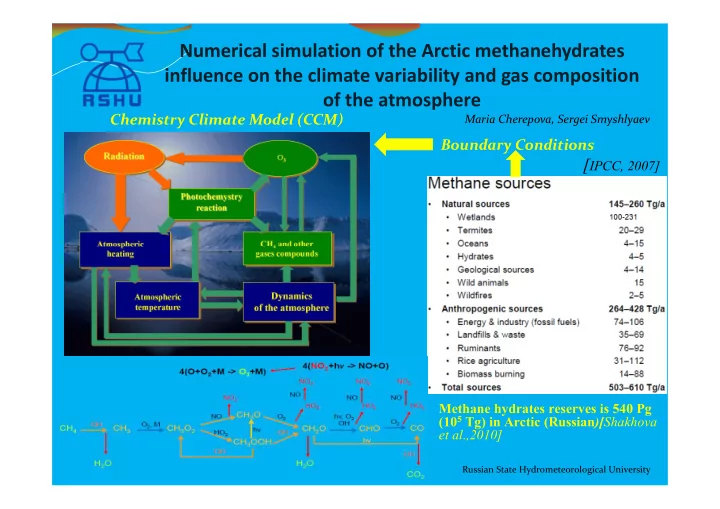
Numerical simulation of the Arctic methanehydrates influence on the climate variability and gas composition
- f the atmosphere
Maria Cherepova, Sergei Smyshlyaev
Russian State Hydrometeorological University
[IPCC, 2007]
Chemistry Climate Model (CCM) Boundary Conditions
Methane hydrates reserves is 540 Pg (105 Tg) in Arctic (Russian)[Shakhova et al.,2010]