No Future Without Transformation Remarks to the HBCU Institute - - PDF document

no future without transformation remarks to the hbcu
SMART_READER_LITE
LIVE PREVIEW

No Future Without Transformation Remarks to the HBCU Institute - - PDF document

No Future Without Transformation Remarks to the HBCU Institute September 8, 2016 President Patricia McGuire Trinity Washington University (Full slide deck at the end of the text, some slides embedded in text for ease of reading) Thank you for


slide-1
SLIDE 1

No Future Without Transformation Remarks to the HBCU Institute September 8, 2016 President Patricia McGuire Trinity Washington University

(Full slide deck at the end of the text, some slides embedded in text for ease of reading)

Thank you for inviting me to address the HBCU Institute this morning! Some of you might be wondering: what does the president of a Catholic women’s college have to say to me as the president of one of the nation’s Historically Black Colleges and Universities? It’s certainly true that our institutions are different in many ways in our formative histories, our different traditions

  • f faith and gender and race, the public conditions that formed our private rituals and habits of

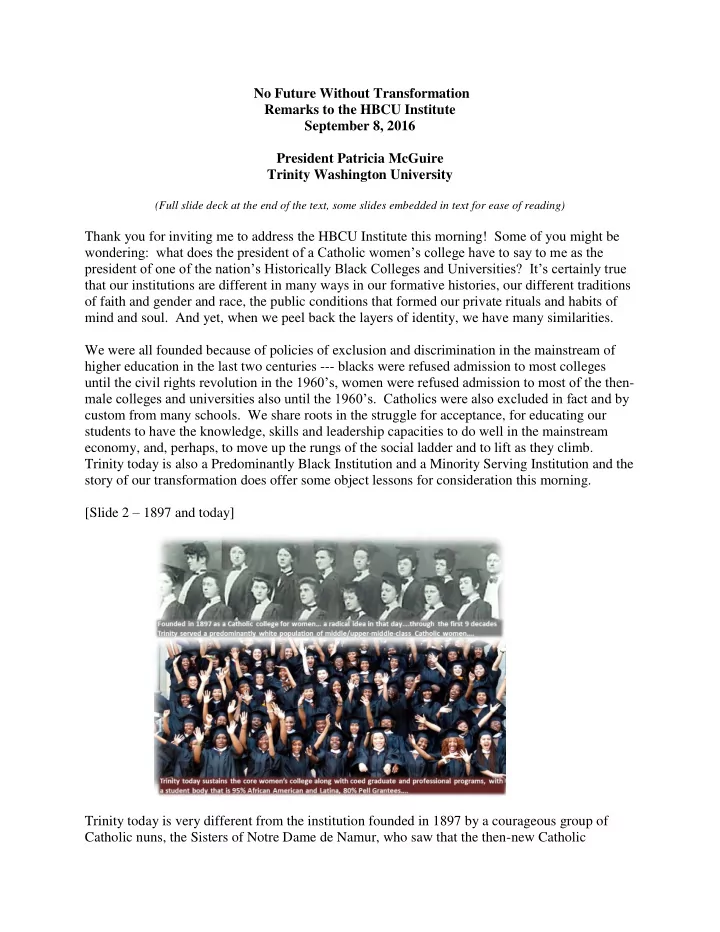
mind and soul. And yet, when we peel back the layers of identity, we have many similarities. We were all founded because of policies of exclusion and discrimination in the mainstream of higher education in the last two centuries --- blacks were refused admission to most colleges until the civil rights revolution in the 1960’s, women were refused admission to most of the then- male colleges and universities also until the 1960’s. Catholics were also excluded in fact and by custom from many schools. We share roots in the struggle for acceptance, for educating our students to have the knowledge, skills and leadership capacities to do well in the mainstream economy, and, perhaps, to move up the rungs of the social ladder and to lift as they climb. Trinity today is also a Predominantly Black Institution and a Minority Serving Institution and the story of our transformation does offer some object lessons for consideration this morning. [Slide 2 – 1897 and today] Trinity today is very different from the institution founded in 1897 by a courageous group of Catholic nuns, the Sisters of Notre Dame de Namur, who saw that the then-new Catholic

slide-2
SLIDE 2

2 University was refusing admission to women and the nuns said that was wrong, that women had a right to have access to the best possible higher education they could obtain. Trinity drew its students over the first seventy years largely from Catholic girls’ high schools in the major eastern cities --- Boston, New York, Philadelphia, Baltimore, Chicago. While there was never a religious test for admission, Trinity’s student body for most of the first part of its history was predominantly White, Catholic and traditional-aged, and middle-to-upper-middle class. Today, Trinity’s student body is more than 90% African American and Latina, with the first year class about 85% Pell Eligible. The majority religion is Baptist. What happened to cause the dramatic change in the Trinity student body? [Slide 3 – enrollment through 1992] The nuns believed that keeping the student body small was a way to promote excellence, and given the very Spartan lifestyle on campus, there were not many extraneous expenses. The religious sisters worked for free --- “contributed services” is what they called it --- and the lay faculty and staff did not earn much money. This very constrained financial model worked well until the higher ed boom of the 1960’s. Like all colleges and universities, Trinity’s enrollment soared in the postwar baby boom years, from 1960 to 1969 the enrollment spiked toward a high of 1000 traditional-aged resident

  • students. But then the bottom dropped out. What happened?

[Slide 4 – external factors] A “perfect storm” of internal and external factors caused Trinity’s calamitous enrollment decline after 1969.

slide-3
SLIDE 3

3 Externally, these factors drove decline among many of the traditional women’s colleges and Catholic colleges that were under-funded like Trinity:

  • Coeducation
  • Title IX + NCAA – rise of big time college sports and the ability of women to play at

highly competitive levels in big universities

  • Religious changes after Vatican II – decline in the “free labor” of religious women;

Catholics increasingly seek and gain acceptance at Ivies and flagship state universities

  • Major federal investments – NSF, NIH, etc. in large universities
  • Renovation of campus infrastructures nationally
  • Shift to public education nationally
  • Increased dominance of non-liberal arts majors
  • Increased diversity of national population of students by race, ethnicity, religion, ability
  • Increased wealth of some large elite schools and increased consumer demands for

amenities Internally, Trinity was also enmeshed in a deep and protracted struggle about the future [Slide 5 – Internal Factors]

  • Inability of institutional players to see these changes and develop effective strategies –

every change was perceived as a threat to tradition, rather than an opportunity to grow – “IF ONLY ADMISSIONS KNEW WHAT THEY WERE DOING” – “IF ONLY THE PRESIDENT KNEW WHAT SHE WAS DOING”

  • An observer: a lack of “institutional capacity” to grow and change with the times –

Trinity was an example of many similar kinds of small, special mission institutions that lacked the sophistication, the resources, the willpower and the overall ability to understand the environment and develop strategies to make effective change in programs, services and target markets

  • Alumnae and Faculty demanded strict adherence to tradition. Members of the Board of

Trustees initially thought that the founding congregation of religious sisters could figure things out. The board lacked the leadership necessary to lead change.

  • In the 1980’s, Trinity had 6 acting or permanent presidents in an 8-year period. The

Middle States accreditors, the auditors and others warned that Trinity was on the verge of collapse if the board did not act more decisively to create change. [Slide 6 – Responses] So, what did Trinity have to do to overcome the factors driving decline and reverse its institutional course?

  • Early changes:
  • Greater emphasis on graduate teacher education (1970’s)
  • Development of a daytime continuing ed program for “returning women”

(1970’s)

slide-4
SLIDE 4

4

  • More aggressive changes:
  • Creation of the “Weekend College” in 1985
  • Development of non-liberal arts majors like Business, Communication,

graduate programs (1980’s)

  • Radical changes:
  • Development of strong Strategic Plan (ongoing) led by president and

board and rooted in a belief that Trinity could sustain historic mission through refocusing the articulation of that mission to new students

  • Refocusing on DC and Maryland women (1990’s)
  • Creation of multiple academic units with more emphasis on professional

studies aligned with workforce needs (1990’s through present)

  • Developing partnerships with business leaders, philanthropists
  • Staying the course in the face of controversy!
  • Stronger board
  • President focused on strategy rather than defending against critics
  • Leveraging volunteer leaders to carry the message of necessary change
  • Winning support through successful results

[Slide 7 – diversified enrollments] What were the results of these action steps? Trinity grew dramatically with diversified enrollments in new units and programs. The changes also enabled the women’s college to find its footing and to grow again. But of course, so much dramatic change was not without critics.

slide-5
SLIDE 5

5 [Slide 8 – Middle States reviewer] The reviewer was commenting on Trinity’s shift toward massive adult education for women. [Slide 9] But in fact, the most radical change was not in the program mix or age of the students, but in the demographic characteristics of the student body that came with the change. In short, Trinity changed the race and social class of the student body, and this is the real story. [Slide 10 – SND comment] How and why did Trinity make this change? In 1989 when I became Trinity’s president, innovative programs for adult returning women and coed programs in graduate teacher education were sustaining the college financially, but in many quarters these programs were viewed as temporary, marginal endeavors to help the institution survive until the day of the Restoration of Trinity to its full mythological golden age. Of the 300 or so traditional-aged young women, the overwhelming majority --- more than 90%

  • -- were white, Catholic, suburban young women from private high schools.

I asked the admissions director how many students we had from the D.C. Public Schools and she replied, “None.” I asked, “Why?” She said, “They can’t do the work here.” And nobody at Trinity at that time saw any problem with that statement. From that day forward, we began the paradigm shift. Strategic planning became the backbone for managing the kind of change that Trinity had to embrace if we were to have a future. As Trinity struggled with questions about its strategic future --- questions that successive Middle States teams had perceived and pushed Trinity to grapple with in prior decades --- the mainstream traditionalists truly believed that the restoration of Trinity was possible “if only” a president would come along who knew what she was doing, “if only” we could get some

slide-6
SLIDE 6

6 competent personnel in admissions who knew how to recruit the same kind of students Trinity had in the past. Our discussions about our strategic future were a tug-of-war between the most radical traditionalists who preferred to die rather than consider any change, and those whose idea of change was to consider coeducation as a way to safeguard our Catholicism, a bulwark against a perceived rising tide of feminism, diversity, and, in their view, mediocrity. Those two competing forces agreed on at least one thing: “declining standards,” a polite euphemism for “too many black students,” must be resisted at all cost! Fortunately, the Sisters of Notre Dame, while increasingly few in number on the faculty and staff, still had moral authority and presence on our board. “Why are we trying so hard to reclaim the past,” declared one such nun at a board meeting, “when there are thousands of women at Trinity’s doorstep who could profit from this education? We founded Trinity to make higher education accessible to women, and countless women still find barriers to achievement. Trinity should be open to them.” Even as the nuns urged us to open wide the doors of opportunity in our full-time undergraduate college, the adult women who were coming in larger numbers to our Weekend College began to see Trinity as a great option for their daughters. Predominantly African American, many single mothers, working full-time while studying Shakespeare on weekends, these were the women who run Washington, the mid-level federal workers managing the administrative affairs of the big agencies, the secretaries and office managers of the law firms and private businesses managing government contracts. They came to Trinity to complete baccalaureate degrees so that they could get promoted at work, improve their economic security for their families --- and they discovered the real power of liberal learning as personally, intellectually and spiritually fulfilling beyond the mere economic incentive. They realized the powerful results of an education focused on making women successful. They brought their daughters, first a trickle and then a great wave, a tsunami of change cresting over the once-impermeable granite walls of Main Hall. [Slide 11]

slide-7
SLIDE 7

7 From 1989 to the Year 2000, Trinity’s student body demographics changed from more than 85% White to more than 65% Black, from predominantly Catholic to predominantly Baptist and other Christian denominations, from middle class to low income. [Slide 12] The changes in race and social class also illustrated the fact that Trinity was fast becoming a preferred institution for students from the District of Columbia and nearby Prince Georges County. [Slide 13 – cover of DC impact statement] and [Slide 14 – DC map]

slide-8
SLIDE 8

8 More than half of Trinity’s full-time undergraduates today are from D.C., and more than 50% of

  • ur total student body are D.C. residents. About one-third of these students are from the “east
  • f the river” neighborhoods that are among the lowest income places in the city. D.C. has one
  • f the highest poverty rates among major metropolitan areas along with one of the highest

median family incomes. D.C. also has a staggering adult illiteracy rate, about 35%, even though it also boasts the highest percentage of earned degrees in the country. D.C. is a city divided, and that divide runs down the center of the map --- and Trinity serves most of the city

  • n the eastern side of the map.

[Slide 15 – Silence] So much change does not occur in silence. When I give workshops on leading institutional change, I always remind my audience that if you don’t hear some noise, you’re not doing your job. All of this data framed the real work: Trinity had to undergo profound change --- a true paradigm shift --- in curricula and programs, services and support systems, policies and practices, and in the size and capacity of faculty and staff to work successfully with a new student population. We had to move our perception from focusing on our students as unprepared for us, to an understanding that we had to be better prepared for them. Many colleagues, particularly older faculty, could not accept the change; early retirement helped them to make the right choice and helped Trinity to recruit a new generation of faculty who proved to be eager to embrace the kind of curricular and pedagogical change we had to have to be

  • successful. We had many angry alumnae. We had to take the time over a period of years to

educate our alumnae about the urgent need for a Catholic college rooted in social justice to be a place where women who have been radically excluded from economic and educational success could, at last, find that success and fulfillment. [Slide 16 – Middle States] Our years of hard work were recognized and praised by our Middle States team in 2006:

slide-9
SLIDE 9

9 Refer to slide deck at the end for all slides referenced from this point forward…. [Slide 17 – to create institutional change] But, aspirational effort aside, how did Trinity really get the change done? [Slide 18 – Envision Trinity 2020] Strategic planning had to be the backbone of all that we did . [Slide 19 – Mission Statement] We started with our mission statement, and vision and values. We took the time to discuss how to keep what we valued historically at the center --- the women’s college, the Catholic values, the liberal arts --- and how to open them up to others. The Mission Statement has deliberate strands that intertwine as a result. [Slide 20 – Strategic Plan Model] We made a very pragmatic decision across our years of planning to put enrollment development at the center of the plan. Strategic Goal #1. No margin, no mission. A small institution that is highly tuition-dependent must build enrollment --- and there’s no shame in that, we exist for our students, and if we cannot reach the students whom we are designed to serve, then we can no longer fulfill mission. Enrollment growth is not just a financial necessity, it is a mission necessity first and foremost. (I’ve been reading a lot about the amazing work of Michael Sorrell at Paul Quinn College – he certainly knows this principle and all of his great innovations and values are driving his quest to build enrollment to a level that is financially sustainable so that his school with its irreplaceable mission can thrive. This is what strategic planning is all about.) All of the other goals in the plan must contribute to enrollment development. [Slide 21 – Strategic Paradigm] Through planning, we were also able to create a strategic institutional organizational model that makes sense for us. We are a relatively small university. You might ask why we have five academic schools. The units are all about support for the students --- each student population is different in its academic ambitions, the professional focus, the developmental needs. We provide deans and advisors for each population. By focusing on the discrete needs of the different student populations, we are able to grow each according to its own needs. [Slide 22 – data sets]

slide-10
SLIDE 10

10 We use a lot of data in strategic planning. Most of this data is readily available through IPEDS and the National Center for Education Statistics. I won’t go through each slide in much detail right now, but let me tell you the highlights: [Slide 23 – NCES Changes in College Enrollment] A study of the NCES projections to 2023 tells us that while the enrollment of traditional-aged students is slowing, the enrollment of part-time adult students is moving at a faster rate, and also the enrollment of Hispanic and Black students continues to grow at impressive rates. This helps us to understand what’s happening with the various populations we serve. For Trinity, this kind of data helped us to educate the traditionalists who thought that we were deliberately ignoring traditional students when, in fact, the demographic trends run in another direction… [Slide 24 – Bachelors Degrees since 1970] As we diversified our academic programs, I found it important to help various constituencies to understand that Trinity was not an anomaly --- in fact, over a 45 year period, what’s most notable about American higher ed is the constancy of growth in business and healthcare majors. This is not an attack on the liberal arts, which remain essential for general education and many majors, but we must know where the markets are trending. [Slide 25 – Masters Degrees since 1970] Same for master’s degrees. [Slide 26 – Diversity and Pell Grantees] We also constantly examine where we are in relation to a cohort of institutions like Trinity, and

  • ther competitors. This slide is something we developed to understand the potential impact of

the “free college” movement which is likely to be disastrous for many institutions that serve very low income students. The blue bars on this chart show private institutions that make-up Trinity’s

  • cohort. The yellow bars are public universities in our region, and the orange bars are public

HBCUs in our region. The main slope shows the proportionate percentage enrollment of Pell Grantees in each school. The red dots show the proportionate percentage enrollment of Black and Hispanic students. The bottom line is that this chart shows that many private institutions serve significantly greater proportions of low income students of color than the relatively wealthy public universities that stand to benefit from the “free college” movement. Agree or disagree with the policy option, a strategic plan must address threats like this in the external environment. [Slide 27 – Pell Grantees and Completion Rates] Our planning effort spends a lot of time on understanding our completion rates compared to our cohort and accounting for the relative poverty of our students. This chart shows our cohort and

slide-11
SLIDE 11

11 including some HBCUs with the backdrop showing the proportionate percentage enrollment of black, Hispanic and white students, and the red line shows Pell Grant percentage and yellow line shows completion rates. We know that the greater enrollment of Pell Grant students, the lower the completion rates on average, and this affects students of color most of all. Figuring out how to address these trend lines is a strategic priority for Trinity. [Slide 28 – Trinity’s Success Rate] We have developed a model that we call the “success rate” which is just about the same as the increasingly well known SAM model, or Student Achievement Measure. This model looks at the rate at which students are still enrolled or have graduated at the first school in which they enrolled and subsequent schools --- we believe this is a fairer measure of success for students who swirl through the system. The current IPEDs measure is all about low admissions risk and brand loyalty. A better rate acknowledges that some schools take a lot more risk in admission, and the fact that students transfer is not a badge of shame but part of the pathways that students -

  • - especially low income students --- find for themselves as they progress through life and

academics together. [Slide 29 – Diversity in the Professoriate] We also take a look at our faculty diversity data all the time because helping our students become successful depends on having a faculty who can do this work and in whom our students have confidence. [Slide 30 – First Year Students] We acknowledge the general challenges of students entering Trinity as part of our strategic assessment of the work that is ours to undertake. [Slide 31 – Strategies for Success – Academic] We have developed strategies for student success that include these components for curriculum and pedagogy: Curriculum and Pedagogy

  • 1. Assessment: Every student is assessed at entrance for Math, Writing and Critical Reading
  • 2. Engagement: Starting at orientation and throughout the first year, faculty and staff execute

specific pedagogies and strategies designed to engage students in learning. Active learning pedagogies are essential; undergraduate research starts early.

  • 3. Specialists: Specialists in the Math, Critical Reading and Writing work alongside regular

faculty to deliver the first year courses successfully. In 2015-2016 with the support of a Mellon grant, the faculty overhauled the Math and reading sequence to get the students into the actual collegiate content earlier and more effectively.

  • 4. Technology: Technology tools (Moodle, MyMathLab, others) support first year instruction.
slide-12
SLIDE 12

12

  • 5. Assessment Again: Instructional specialists assess the results of every course each semester

and write aggregate reports of progress in the specific gateway areas.

  • 6. Career Pathways: With the addition of Nursing, Occupational Therapy, Criminal Justice and
  • ther new majors with more specific career pathways, student have additional incentive for

higher achievement in general education.

  • 7. Internships: Internships and experiential learning link students to the workforce
  • pportunities early and frequently.

[Slide 32 – Strategies for Success- Support] In the same way, we have strategies for academic support…. [Slide 33 – Strategies for Success – co-curricular] …. And co-curricular services…. [Slide 34 – Outcomes] Our outcomes data tells us that our graduates are largely very successful, but we know we can never rest on these laurels. What really matters is whether each student enrolled today and in the future can become successful in all of the ways she believes are important. When our students succeed, Trinity succeeds! I hope these ideas are useful to you, and I’m happy to answer questions… [Slide 35 – their Success is our goal!]

slide-13
SLIDE 13
slide-14
SLIDE 14

2

Founded in 1897 as a Catholic college for women… a radical idea in that day….through the first 9 decades Trinity served a predominantly white population of middle/upper-middle-class Catholic women…. Trinity today sustains the core women’s college along with coed graduate and professional programs, with a student body that is 95% African American and Latina, 80% Pell Grantees….

slide-15
SLIDE 15

200 400 600 800 1000

1900 1901 1902 1903 1914 1917 1919 1920 1948 1949 1950 1951 1952 1953 1954 1955 1956 1957 1958 1959 1960 1961 1962 1963 1964 1965 1966 1967 1968 1969 1970 1971 1972 1973 1974 1975 1976 1977 1978 1979 1980 1981 1982 1983 1984 1985 1986 1987 1988 1989 1990 1991 1992

Trinity FT Undergrad Headcount 1900 to 1992

CAS

Starting with 19 bold women in 1900, Trinity’s traditional enrollment grew and peaked at 966 in 1969, then started a precipitous decline toward the bottom at 323 in 1992. Through those years, Trinity’s full-time undergrads were predominantly white, Catholic and traditional-aged residential students majoring in liberal arts.

3

slide-16
SLIDE 16

External Factors Hastening Trinity’s Enrollment Decline after 1969

  • Coeducation
  • Title IX + NCAA – rise of big time college sports and the ability of women to play at highly

competitive levels in big universities

  • Religious changes after Vatican II – decline in the “free labor” of religious women; Catholics

increasingly seek and gain acceptance at Ivies and flagship state universities

  • Major federal investments – NSF, NIH, etc. in large universities
  • Renovation of campus infrastructures nationally
  • Shift to public education nationally
  • Increased dominance of non-liberal arts majors
  • Increased diversity of national population of students by race, ethnicity, religion, ability
  • Increased wealth of some large elite schools and increased consumer demands for amenities4
slide-17
SLIDE 17

Internal Factors: Blame, Capacity, Tradition

  • Inability of institutional players to see these changes and develop effective

strategies – every change was perceived as a threat to tradition, rather than an

  • pportunity to grow

– “IF ONLY ADMISSIONS KNEW WHAT THEY WERE DOING” – “IF ONLY THE PRESIDENT KNEW WHAT SHE WAS DOING”

  • An observer: a lack of “institutional capacity” to grow and change with the times –

Trinity was an example of many similar kinds of small, special mission institutions that lacked the sophistication, the resources, the willpower and the overall ability to understand the environment and develop strategies to make effective change in programs, services and target markets

  • Alumnae and Faculty demanded strict adherence to tradition. Members of the

Board of Trustees initially thought that the founding congregation of religious sisters could figure things out. The board lacked the leadership necessary to lead change.

  • In the 1980’s, Trinity had 6 acting or permanent presidents in an 8-year period.

The Middle States accreditors, the auditors and others warned that Trinity was on the verge of collapse if the board did not act more decisively to create change.

5

slide-18
SLIDE 18

What did Trinity do to respond to external threats and internal stasis?

  • Early changes:
  • Greater emphasis on graduate teacher education (1970’s)
  • Development of a daytime continuing ed program for “returning women” (1970’s)
  • More aggressive changes:
  • Creation of the “Weekend College” in 1985
  • Development of non-liberal arts majors like Business, Communication, graduate

programs (1980’s)

  • Radical changes:
  • Development of strong Strategic Plan (ongoing) led by president and board and rooted in

a belief that Trinity could sustain historic mission through refocusing the articulation of that mission to new students

  • Refocusing on DC and Maryland women (1990’s)
  • Creation of multiple academic units with more emphasis on professional studies aligned

with workforce needs (1990’s through present)

  • Developing partnerships with business leaders, philanthropists
  • Staying the course in the face of controversy!
  • Stronger board
  • President focused on strategy rather than defending against critics
  • Leveraging volunteer leaders to carry the message of necessary change
  • Winning support through successful results

6

slide-19
SLIDE 19

200 400 600 800 1000 1200 1400 1600 1800 2000 2200 2400 2600 2800

1900 1901 1902 1903 1914 1917 1919 1920 1948 1949 1950 1951 1952 1953 1954 1955 1956 1957 1958 1959 1960 1961 1962 1963 1964 1965 1966 1967 1968 1969 1970 1971 1972 1973 1974 1975 1976 1977 1978 1979 1980 1981 1982 1983 1984 1985 1986 1987 1988 1989 1990 1991 1992 1993 1994 1995 1996 1997 1998 1999 2000 2001 2002 2003 2004 2005 2006 2007 2008 2009 2010 2011 2012 2013 2014 2015

Diversification of Trinity’s Enrollments and Programs 1900-2015

CAS EDU SPS BGS NHP

7

Trinity chose to keep its core women’s college (yellow) but had to figure out institutional sustainability. From 1990 onward, rooted in strategic plans, Trinity diversified its academic model as well as programs and student body. Diversification ensured enough revenue streams to offset downturns in some program areas. Ironically, 20 years later, the women’s college is the biggest and strongest of the five academic schools.

slide-20
SLIDE 20
slide-21
SLIDE 21
slide-22
SLIDE 22
slide-23
SLIDE 23

85% 39% 11% 4% 10% 51% 63% 67% 5% 5% 7% 14% 5% 5% 19% 15% 0% 10% 20% 30% 40% 50% 60% 70% 80% 90% 100% 1979 1995 2004 2015

Trinity Enrollment By Race 1979 to 2015

Other Hispanic Black White

11

slide-24
SLIDE 24

$50,000 $30,000 $25,000 $50,000 $75,000 $75,000

$0 $10,000 $20,000 $30,000 $40,000 $50,000 $60,000 $70,000 $80,000 1995 2008 2015

Median Family Income

Trinity (Yellow) v. National Cohort Comparison (Purple)

Median Family Income Estimates First Year Students (CIRP Data) 12

slide-25
SLIDE 25

13

slide-26
SLIDE 26

14

slide-27
SLIDE 27

Change does not occur in silence.

If you don’t hear some noise, you’re not doing your job.

15

slide-28
SLIDE 28
slide-29
SLIDE 29

To create sound institutional change, a strong strategic plan rooted in ongoing analysis of internal and external data is essential. The plan should include external and internal environmental assessment, cohort benchmarks, national data trends, analysis of internal capacity, and delineation of values to support mission.

17

slide-30
SLIDE 30

18

slide-31
SLIDE 31

19

Trinity Mission Statement

Trinity is a comprehensive university offering a broad range of educational programs that prepare students across the lifespan for the intellectual, ethical and spiritual dimensions of contemporary work, civic and family life. Trinity’s core mission values and characteristics emphasize:

  • Commitment to the Education of Women in a particular way through the design and

pedagogy of the historic undergraduate women’s college, and by advancing principles of equity, justice and honor in the education of women and men in all other programs;

  • Foundation for Learning in the Liberal Arts through the curriculum design in all

undergraduate degree programs and through emphasis on the knowledge, skills and values of liberal learning in all graduate and professional programs;

  • Integration of Liberal Learning with Professional Preparation through applied and

experiential learning opportunities in all programs;

  • Grounding in the mission of the Sisters of Notre Dame de Namur and the Catholic

tradition, welcoming persons of all faiths, in order to achieve the larger purposes of learning in the human search for meaning and fulfillment.

slide-32
SLIDE 32

20

slide-33
SLIDE 33

School of Education School of Business and Graduate Studies School of Professional Studies School of Nursing and Health Professions College of Arts and Sciences

Trinity Strategic Paradigm 2015-2020

Strategic Paradigm 2015-2020

21 Five academic units comprise Trinity’s core organizational design. The primary purpose of each unit is to ensure high quality academic programs and appropriate services for each student population. Each unit has a dean and administrative team including academic advisors as well as faculty. The units are interdependent and share elements of curricula and faculty across disciplines, but faculty have a primary “home” in each unit. The academic units receive services and support from the centralized administrative divisions depicted on the next slide.

slide-34
SLIDE 34

Following are samples of some of the data sets we include in strategic plan discussions…

22

slide-35
SLIDE 35

23

42% 45% 52% 24% 40% 44% 49% 33% 43% 41% 15% 12% 23% 17% 10% 20% 14% 18% 14% 25% 7% 25% 34% 11% 1% 14%

0% 10% 20% 30% 40% 50% 60%

Changes in College Enrollment Rates of Growth Comparing 1998-2012 to Projected 2012-2023

Source: USDE, NCES, Projections of Education Statistics to 2023

1998-2012 2012-2013

slide-36
SLIDE 36

839,730 1,869,814

115,396 143,171 200,521 236,700 249,165 226,623 263,515 318,042 365,133 358,079 25,223 53,885 63,665 65,309 59,875 86,087 75,933 91,973 143,463 198,770 155,324 126,396 100,513 93,840 125,107 126,479 128,036 161,485 177,169 173,096 38,187 50,278 41,068 40,628 58,655 73,416 73,645 88,134 100,906 117,298 35,705 54,154 43,078 38,395 39,482 61,014 60,576 70,607 89,984 104,633 176,307 154,437 108,074 87,147 110,807 105,384 105,458 107,238 104,008 98,854 10,324 20,045 29,428 41,666 51,650 47,320 58,013 73,955 83,231 87,604 63,914 41,452 31,922 34,083 51,064 49,928 50,569 55,096 52,754 50,404 200,000 400,000 600,000 800,000 1,000,000 1,200,000 1,400,000 1,600,000 1,800,000 2,000,000

1970-71 1975-76 1980-81 1985-86 1990-91 1995-96 2000-01 2005-06 2010-11 2013-14

National Bachelors Degrees 1970-71 to 2013-2014

Source: NCES 2016 Digest of Ed Stats

TOTAL ENGLISH COM/JLSM EDU BIO/MED PSYCH SOCSCI HEALTH BUSINESS

The other strategic issue to keep in mind: Nationally, majors in Business, Healthcare, Social Sciences, Psychology and Biology/Medicine are the largest fields ……and have been since at least 1970. 24

slide-37
SLIDE 37

235,564 754,475

26,490 42,592 57,888 66,676 78,255 93,554 115,602 146,406 187,178 189,328 87,666 126,061 96,713 74,816 87,352 104,936 127,829 174,620 185,127 154,636 5,330 12,164 16,176 18,603 21,354 33,920 43,623 51,380 75,571 97,403 7,785 15,209 17,803 15,692 17,905 24,229 25,268 30,510 38,614 44,490 16,813 16,472 16,893 21,529 24,454 26,789 25,174 30,848 38,664 42,372 5,717 10,167 10,223 9,845 11,349 15,152 16,539 19,770 25,062 27,966 1,588 2,603 4,218 8,070 9,324 10,579 16,911 17,055 19,516 24,532 16,539 15,953 11,945 10,564 12,233 15,012 13,791 17,369 21,085 21,475 100,000 200,000 300,000 400,000 500,000 600,000 700,000 800,000

1970-71 1975-76 1980-81 1985-86 1990-91 1995-96 2000-01 2005-06 2010-11 2013-14

National Masters Degrees 1970-71 to 2013-2014

Source: NCES 2016 Digest of Ed Stats

TOTAL SOCSCIENCE COMPUTERSCI PSYCHOLOGY ENGINEERING PUBADSOCSERV HEALTHPROFS EDUCATION BUSINESS

The other strategic issue to keep in mind: Nationally, masters in Business, Education, Healthcare, Social Sciences, Psychology and Computer Science are the largest fields now --- and see how the master’s level has grown since 1970 25

slide-38
SLIDE 38

87 84 81 73 73 71 68 67 62 62 60 59 59 58 58 57 55 55 54 53 53 52 52 51 50 50 49 47 47 47 46 37 35 33 32 31 30 28 28 28 27 25 24 23 23 22 21 16 15 15 14 13 13 13 10 59 44 81 69 37 45 72 87 49 39 33 69 17 85 63 41 21 20 20 71 10 35 27 35 86 27 23 38 13 11 25 30 19 27 15 19 17 28 19 17 7 19 13 21 15 12 22 11 13 9 19 11 9 9 14

10 20 30 40 50 60 70 80 90 100 10 20 30 40 50 60 70 80 90 100

CNR MRYGRV TRINITY UDC CSE FELICIAN OURLDYLK VASTATE BARRY ROSEMT ALVERNO UMES SAGE MORGAN MSMLA DOMILL CEDAR GEORGIAN CARLOW DELST WVAST NDDENM NDMD CUNYHNTR BOWIE CALDWELL NEUMANN CHESTNUT STCATE CHATHAM URSULINE FROSTBURG USJ MRYMTMAN SUNYSB SUNYNP HOOD MRYMT RUTGERS IMMACU WESTVA MASON EMMANUEL TOWSON WSTCHSTR LESLEY UMBC UDEL MARYWAS VATECH UMD UVA MADISON PENNST WMMARY

Diversity + Pell % 1st Yr FT: 2015 IPEDS Data Comparing 30 Small Private Colleges (Blue)

with 25 Public Universities (Yellow - Orange = Public HBCU)

Note: 30 private colleges = Trinity’s benchmark cohort, Largely historic women’s colleges, small Catholic colleges In urban areas; the 25 public institutions are the major Universities in Trinity’s regional zone in DC, Maryland,

This chart shows the combined Black/Hispanic student body percentage (Red Diamond) along with the Pell Grant percentages

slide-39
SLIDE 39

10 20 30 40 50 60 70 80 90 100 0% 10% 20% 30% 40% 50% 60% 70% 80% 90% 100%

EMMANUEL IMMACULATA MRYMTMAN STEVENSON USTJOE CHESTNUT SPELMAN HOWARD CHATHAM WESLEYAN NDDENAMUR MTALOY CEDCREST COLUMBIA BOWIE CARLOW MARYBALD NDMD URSULINE DELSTATE UMES GEORGIAN XAVIERLA MORGAN BARRY LINCOLN NORFOLK VASTATE LADYLAKE MTSTMARY UDC ALVERNO MERCY CSTELIZ DILLARD MARYGROVE CHEYNEY BENNETT TRINITY CNR HERITAGE

Select Cohort Sorted First by Pell Frosh Participation then showing IPEDS 2007 Grad Rates and Proportionate Enrollment of White/Black/Hispanic Students

HISPANIC BLACK WHITE PELL FROSH 06 GRAD RATE

27

slide-40
SLIDE 40

32% 34% 45% 41% 13%

2% 4% 4% 2% 32% 42% 13% 8% 6% 4% 8% 13% 6% 10% 14% 26%

15% 22% 16% 9% 11% 10%

10% 5% 8% 7% 7% 8% 9% 7% 7% 15% 17% 8% 9% 7% 7% 8% 7% 5%

57% 59% 62% 61% 57% 69%

30% 33%

0% 10% 20% 30% 40% 50% 60% 70% 80% 90% 100%

2006 2007 2008 2009 2010 2011

First Time Full Time Cohort Initial Enrollment Fall

Trinity Cohort Completion and Continuing Enrollment/Attrition With Clearinghouse Data for Cohorts from Fall 2006 to Fall 2013 And Pell Grant Completion Rates for 2006 and 2007 Cohorts

Good ACST ACAPRO Bad ACST Fin Hold Enroll Other BA Other AA Other Enroll Trinity BA Trinity Success Rate Pell Completion

On the columns above, the dark purple is the completion rate at Trinity, the light purple is still enrolled at Trinity, the blues are completed or still enrolled at other institutions, and the red line and number is the “success rate.” The cohorts that began in 2006-2007-2008 have largely finished degrees by now. The cohorts for 2009-2013 are mostly still in school. Above the line, the columns show attrition because of money (green) or academic reasons.

slide-41
SLIDE 41

Diversity in the Professoriate

Percent of full-time faculty at U.S. Degree Granting Institutions by Race/Ethnicity: 15-Year Longitudinal Data

2001 2003 2005 2011 2013 TRINITY 2015 % of Total US Pop 2016

White

80.9 80.2 78.1 74.0 72.7 47% 61.6% (non- Hisp/Lat)

Black

5.1 5.3 5.2 5.5 5.5 38% 13.3%

Hispanic/Latino

3.0 3.2 3.4 4.1 4.2 3% 17.6%

Asian/ Pacific Islander

6.2 6.5 7.2 8.8 9.1 10% 5.6%

American Indian/ Alaska Native

0.4 0.5 0.5 0.5 0.4 1.2%

Source: U.S. Department of Education, National Center for Education Statistics, 1985, 1991, 1995, 2001, 2003, 2005, 2011, and 2013 Integrated Postsecondary Education Data System (IPEDS), Fall 1985, Fall 1991, Fall 1995, Fall 2001, Fall 2003, Fall 2005, Fall 2011 and United States Census Bureau Quickfacts, available: https://www.census.gov/quickfacts/table/PST045215/00. Also from Espino, M., and Griffin, K. (2016). Faculty Diversity in American Higher Education: Challenges and Opportunities. ACE Convening on Faculty of Color, April 25, Washington DC.

slide-42
SLIDE 42
  • 85% of entering first year students in Fall 2015 are Pell eligible
  • $25,000 is the approximate median family income
  • 25% of first years estimate their family income at $10,000 or less
  • 63% of first years identify as African American, 32% as Hispanic
  • Majority are self-supporting
  • Most work more than 20 hours per week, many work 40+ hours
  • About 15% of first year young women have children already
  • About 40% have health issues that can impede academic progress
  • Math, writing, critical reading skills are deficient
  • Knowledge of “the academic vocabulary” and culture is limited

30

slide-43
SLIDE 43

Curriculum and Pedagogy

  • 1. Assessment: Every student is assessed at entrance for Math, Writing and Critical Reading
  • 2. Engagement: Starting at orientation and throughout the first year, faculty and staff execute

specific pedagogies and strategies designed to engage students in learning. Active learning pedagogies are essential; undergraduate research starts early.

  • 3. Specialists: Specialists in the Math, Critical Reading and Writing work alongside regular

faculty to deliver the first year courses successfully. In 2015-2016 with the support of a Mellon grant, the faculty overhauled the Math and reading sequence to get the students into the actual collegiate content earlier and more effectively.

  • 4. Technology: Technology tools (Moodle, MyMathLab, others) support first year instruction.
  • 5. Assessment Again: Instructional specialists assess the results of every course each semester

and write aggregate reports of progress in the specific gateway areas.

  • 6. Career Pathways: With the addition of Nursing, Occupational Therapy, Criminal Justice and
  • ther new majors with more specific career pathways, student have additional incentive for

higher achievement in general education.

  • 7. Internships: Internships and experiential learning link students to the workforce
  • pportunities early and frequently.

31

slide-44
SLIDE 44

Academic Support

1. Tutors and workshops: math, writing, critical reading. “Monday Mathematics” has proven to be an immensely popular method to engage reluctant students in additional informal instruction with faculty members. 2. Learning skills support: through the Academic Services Center students can access staff and programs that assist them with a wide variety of academic issues 3. Disabilities Support: Trinity’s support for students with disabilities keeps expanding 4. First Year Advising and Services: Success in the first year is crucial to the ultimate goal of timely completion. In addition to all of the other supports, Trinity’s first year experience program includes

  • Professional Advising
  • Triage Program
  • Appreciative Advising
  • Taking Attendance
  • Health Assessment

32

slide-45
SLIDE 45

Co-Curricular Support and Services 1. Health Services 2. Residence Life 3. Athletics 4. Campus Ministry 5. Traditions: Signs and Symbols of Belonging Partnerships 1. College Success Foundation 2. College Access Program 3. KIPP, other charter schools, public schools, Catholic schools 4. Cristo Rey Network 5. Girl Scouts 6. Generation Hope (Project for young mothers)

33

slide-46
SLIDE 46

A recent survey of Trinity graduates from 2002 to 2012 (survey to be conducted again in 2016-2017) points to these results: of those who have answered…

  • 95% are currently employed with a median salary range of $60,000-$69,000
  • 70% have pursued some graduate studies since graduation; 60% have completed graduate

degrees and 36% are still enrolled for a total persistence/completion rate of 96% for graduate degrees; the graduate schools they have attended include universities such as Georgetown, the London School of Economics, American University, Howard University, the University of Pennsylvania, UMUC, Bowie, Towson, Phoenix and Trinity

  • Within one year of graduation, 78% reported that they were immediately employed and 32%

were in graduate school

  • 85% of respondents say that they are employed in the same or related field as their major, or

in a different field by choice;

  • The most important knowledge and skills the respondents said they received from their

Trinity education include excellence in written and oral communication, critical thinking and a deep sense of ethics.

34

slide-47
SLIDE 47

Their Success is Our Entire Goal!