
SLIDE 1
TSX-V BTR | OTCQX BONXF | FSE 9BR2
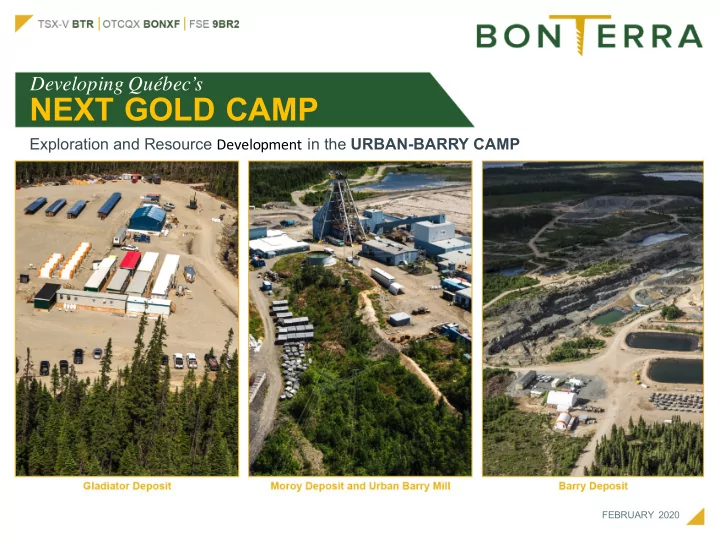
NEXT GOLD CAMP
Exploration and Resource Development in the URBAN-BARRY CAMP
Developing Québec’s
FEBRUARY 2020
NEXT GOLD CAMP Exploration and Resource Development in the - - PowerPoint PPT Presentation
TSX-V BTR | OTCQX BONXF | FSE 9BR2 Developing Qubecs NEXT GOLD CAMP Exploration and Resource Development in the URBAN-BARRY CAMP FEBRUARY 2020 Forward-Looking Statements This presentation contains "forward-looking information"
TSX-V BTR | OTCQX BONXF | FSE 9BR2
FEBRUARY 2020
2
This presentation contains "forward-looking information" within the meaning of Canadian securities legislation. Any information herein with respect to predictions, expectations, projections, objectives, assumptions or future events that are not historical facts may be "forward- looking statements” that are based on Bonterra’s current expectations, estimates and projections. This forward-looking information includes information with respect to the planned exploration programs, the costs and expenditures for the upgrading of the Bonterra mill and timelines, the potential growth in mineral resources, and other information that is based on forecasts of future operational or financial results, estimates of amounts not yet determinable and assumptions of management. Exploration results that include drill results on wide spacings may not be indicative of the occurrence of a mineral deposit; such results do not provide assurance that further work will establish sufficient grade, continuity, metallurgical characteristics and economic potential to be classed as a category of mineral resource. The potential quantities and grades of drilling targets are conceptual in nature and, there has been insufficient exploration to define a mineral resource, and it is uncertain if further exploration will result in the targets being delineated as mineral resources. Forward-looking information is subject to known and unknown risks, uncertainties and other factors that may cause Bonterra’s actual results, level of activity or achievements to be materially different from those expressed or implied by such forward-looking information. Such factors include, but are not limited to: uncertainties related to exploration and development; the ability to raise sufficient capital to fund exploration and development or the upgrading of the mill; changes in economic conditions or financial markets; increases in input costs; litigation, legislative, environmental and other judicial, regulatory, political and competitive developments; or inability to obtain permits encountered in connection with exploration activities or the mill expansion; and labour relations matters. This list is not exhaustive of the factors that may affect our forward-looking information. These and other factors should be considered carefully, and readers should not place undue reliance on such forward-looking information. Bonterra may, from time to time, make oral forward-looking statements and advises that the above paragraph and the risk factors described in this presentation and in the Company’s other documents filed with the Canadian securities authorities should be read for a description of certain factors that could cause the actual results of the Company to differ materially from those in the oral forward-looking statements. The forward-looking information and statements contained in this presentation are made as of the date hereof and the Company undertakes no
future events or otherwise, except as required by applicable securities laws. Note on Technical Information Pascal Hamelin, ing, the Company's Vice President of Operations has reviewed and approved the scientific and technical information contained in this presentation. Mr. Hamelin holds a bachelor's degree in engineering, is a member of the Ordre des ingénieurs du Québec and is a qualified person as defined in National Instrument 43-101 - Standards of Disclosure for Mineral Projects ("NI 43-101") under Canadian legislation. The Company uses a rigorous QA-QC analytical program according to industry standards. The analytical results were done by pyroanalysis (A.A.) at the Company’s laboratory. Blanks, duplicates and certified reference standards are inserted into the sample stream to monitor laboratory performance. The Company’s QA-QC analytical verification program requires that a minimum of 10% of the samples be audited at an independent laboratory. Theses audit assays were sent to ALS laboratory located in Val-d'Or, Quebec. The results
Certain information in this presentation regarding the presence of mineral deposits, and the size of such deposits is based on information that has been obtained from publicly available information and industry reports. Such reports generally state that the information contained therein has been obtained from sources believed to be reliable, but the accuracy or completeness of such information is not guaranteed. We have not independently verified or cannot guarantee the accuracy or completeness of that information and investors should use caution in placing reliance on such information. Results from other projects are provided for information purposes only and are not indicative of the results that may be obtained from the Company's properties. All references to “$” or “dollars” herein are to Canadian dollars, unless otherwise indicated.
3
BACHELOR PROPERTY 12,000 hectares
Windfall (Osisko)
Desmaraisville Lebel-Sur-Quévillon
To Val d’Or 155 km
N
Bachelor Mill URBAN-BARRY PROPERTY 22,000 hectares M&I 667,000T @ 5.17 g/t Au: 111,000 oz Inferred 396,000T @ 4.32 g/t Au: 55,000 oz MOROY PROJECT Indicated: 2,052,000T @ 5.84 g/t Au: 385,000 oz Inferred: 2,740,000T @ 5.14 g/t Au: 453,000 oz BARRY PROJECT Indicated: 743,000T @ 8.46 g/t Au: 202,000 oz Inferred: 3,065,000T @ 9.10 g/t Au: 897,000 oz GLADIATOR PROJECT
4
Pascal Hamelin
VP Operations
Pascal holds a Mining Engineering Degree decreed by Polytechnique Montréal, Mr. Hamelin is a member of the Ordre des Ingénieurs du Québec, and the Professional Engineers Ontario. Pascal brings twenty-eight years in mining project management. His experience was acquired primarily in the Sudbury camp, and the Abitibi camp.
Greg Gibson
Chairman & CEO
cumulates over 35 years’ experience in the mining industry as a miner, mine manager, director, CEO and President. Greg’s experience has focused on gold and copper mines primarily in Canada, US, and Australia.
Johnny Oliveira
Chief Financial Officer
in the accounting profession including audit, accounting, tax, financial management and reporting and corporate finance. Over the past 10 years Mr. Oliveira has served as chief financial officer, corporate secretary or financial reporting manager of several junior mining companies. Mr. Oliveira graduated from the University of Wilfred Laurier with an Honours Bachelor of Business Administration.
Jamie Lavigne
P .Geo, VP Exploration
Jamie Lavigne is an experienced economic geologist who has held leadership roles in several successful exploration, resource delineation, and mine development projects. As a consulting geologist, Jamie specialized in advanced exploration, resource delineation and estimation. Mr. Lavigne holds a B.Sc. (Geology) from Memorial University of Newfoundland and a M.Sc. (Geology) from the University of Ottawa.
5
Allan J. Folk
Director
Over 35 years of extensive leadership experience in the Canadian mining finance industry. Currently Vice President of Brant Securities Ltd.
Matthew Happyjack
Director
experience in leadership and business
Val-d’Or, Québec. He is actively involved in promoting the economic development of The Cree First Nation of Waswanipi.
Certificate in Accounting from the Université du Québec en Abitibi- Témiscaminque. He also holds certificates in Community Economic Development and Management and in Community Management, from Concordia University.
Christina Ouellette
Director
experience in Human Resources and management acquired through a number
Gold Corp, FNX Mining, Dynatec and Domtar Forestry. She has a proven track record in providing leadership and strategy in the development and growth phase of mining operations, as well as merger and acquisition transactions.
Akiba Leisman
Director
serves as the CEO of Sailfish Royalty Corp. Mr. Leisman has an MBA from New York University, and a B.S. in Chemical Engineering from Carnegie Mellon University.
Capital Structure(1)
Issued & Outstanding Shares 77.5 M Options 2.7 M Fully Diluted 85.9 M Total Debt $ 0.00 Ticker BTR.TSX-V Market Cap (Feb. 26/20) $ 122.4 M Warrants 5.6 M
(1) As of February 26, 2020
Analyst Coverage
Sprott Capital Brock Salier PI Financial Corp Philip Ker
BTR TSX-V C$
Closing price $ 1.58 52-week range $ 1.46 – $ 3.02 Market Cap $ 139.5 M 30-day daily trading avg. 76,000 Shs
Strong cash position Strong Institutional Ownership
6 Kirkland Lake Gold 12.5% Nine Point Partners LP 7.0% Eric Sprott 6.9% Sodemex Development Fund 2.7% Sentry Investment Mgt 5.1% VanEck Investment Co. 5.5%
BTR
Other 60.3%
7
DEPOSIT MEASURED INDICATED INFERRED
Tonnes Au (g/t) Ounces Au Tonnes Au (g/t) Ounces Au Tonnes Au (g/t) Ounces Au Gladiator
8.46 202,000 3,065,000 9.10 897,000 Barry
5.84 385,000 2,740,000 5.14 453,000 Moroy 302,000 5.66 55,000 365,000 4.77 56,000 396,000 4.32 55,000 Total 302,005 5.66 55,000 3,160,000 6.33 643,000 6,201,000 7.04 1,405,000
DEPOSIT TOTAL OUNCES DISCOVERED METRES DRILLED OUNCES/METRE DRILLED CAD/OZ DISCOVERED
Gladiator 1,099,000 196,000 5.6 $ 17.83 Barry 838,000 142,000 5.9 $ 16.95 Moroy 166,000 73,000 2.3 $ 43.98 Total 2,103,000 411,000 5.1 $ 19.54
Mineral resources are reported at a cut-off grade of 3.5 g/t Au for Gladiator and Barry, and 3.0 for Moroy. Cut-off grades are based on a gold price of US$1,300 per ounce, a foreign exchange rate of US$0.75, gold recoveries of 93% - 95%, and reasonable mining, processing and transportation costs. See Appendix 1 for notes to NI 43-101
8
9
Indicated: 743,000 t @ 8.5 g/t, 202,000 oz Inferred: 3,065,000 t @ 9.1 g/t, 897,000 oz Vertical Long Section Looking Northwest, Resource Block Model, All Lenses Projected to Section
300 m 600 m 900 m 1,200 m 300 m 600 m 900 m Au (g/t) 3.5 5 1
OPEN
10
Vertical Cross Section Looking Southwest with Selected 2019 Results and up-dip Target Area
BA-19-39: 5.5 g/t Au over 1.5 m BA-19-40: 101.1 g/t Au over 3.9 m
Mineralized Zone Blocks above cut-off grade Felsic Dyke Shear Zone Drill Intersept Legend
Target Area
11
12
13
13
14
300 m 600 m 900 m 300 m 600 m Au (g/t) 3.5 5 1
OPEN OPEN OPEN
Vertical Long Section Looking Northwest, Resource Block Model, All Lenses Projected to Section
Indicated Resources: 2,052,000 t @ 5.8 g/t; 385,000 oz Inferred Resources: 2,740,000 t @ 5.1 g/t; 453,000 oz
15
5.9 g/t Au over 1.5 m 4.5 g/t Au over 1.9 m 11.6 g/t Au over 2.9 m 12.7 g/t Au over 1.8 m 14.8 g/t Au over 0.5 m
Chargeability Target Chargeability Target (assumed continuity under lake) Chargeability Target
/
Gold Intersection 2019 Barry Mineralized Zone Legend
16
17
18
19
20
21
22
Bachelor Shaft
Bachelor Mine Moroy Project
23
Planned stopes Level 11 Sub 1 Sub 2 Sub 3 Sub 4
Bulk Sample Timeline
24
25
26
26
27
Bachelor Mill 6,700 oz Lac Rose 28,000 oz Cartwright 531,500 oz Discovery 510,000 oz Osborne-Bell 303,700 oz Flordin 42,800 oz Toussaint 37,300 oz Morono 24,000 oz Gandex 82,300 oz Lac Short 45,000 oz Mariposite 64,800 oz Fenton Lake South Inferred1.1 Mt @ 12.14 g/t/ 433,000 oz
Lebel-Sur-Quévillon Matagami Chibougamau Chapais
N
Indicated: 2,052,000T @ 5.84 g/t Au: 385,000 oz Inferred: 2,740,000T @ 5.14 g/t Au: 453,000 oz
BARRY PROJECT
Indicated: 743,000T @ 8.46 g/t Au: 202,000 oz Inferred: 3,065,000T @ 9.10 g/t Au: 897,000 oz
GLADIATOR PROJECT
M&I 667,000T @ 5.17 g/t Au: 111,000 oz Inferred 396,000T @ 4.32 g/t Au: 55,000 oz
MOROY PROJECT
MONSTER LAKE Inferred: 97 Mt @ 1.02 g/t, 3.19 Moz NELLIGAN Indicated: Indicated - 4.1Mt @ 9.1 gm 1.2M oz Inferred: 14.5Mt @ 8.4 gm 3.9M oz WINDFALL
28
PROJECT SCOPE: Remove existing 10x12 rod mill, 3 small ball mills Add a SAG mill (6.4 m x 4.0 m, 2,240 kW) Add one ball mill ( 4.7 m x 6.4 m, 2,238 kW) Add a 75 ft thickener Add 9 tanks for leaching-adsorption
29
30
TSX-V BTR | OTCQX BONXF | FSE 9BR2
2872 Ch. Sullivan Bur. 2 Val-d’Or, Quebec J9P 0B9
VP Investor Relations ir@btrgold.com +1 819-825-8678
www.btrgold.com
32
Mineral Reserves
Measured and Indicated Mineral R esource and must not be converted to a Mineral R eserve. It is reasonably expected that the maj ority of Inferred Mineral Resources could be upgraded to Indicated Mineral Resources with continued exploration.
Moroy Deposit mineralization are considered amenable for underground extraction.
used to estimate the tonnage from block model volumes for Moroy and Barry, and 2.78 for Gladiator.
Model Parameters