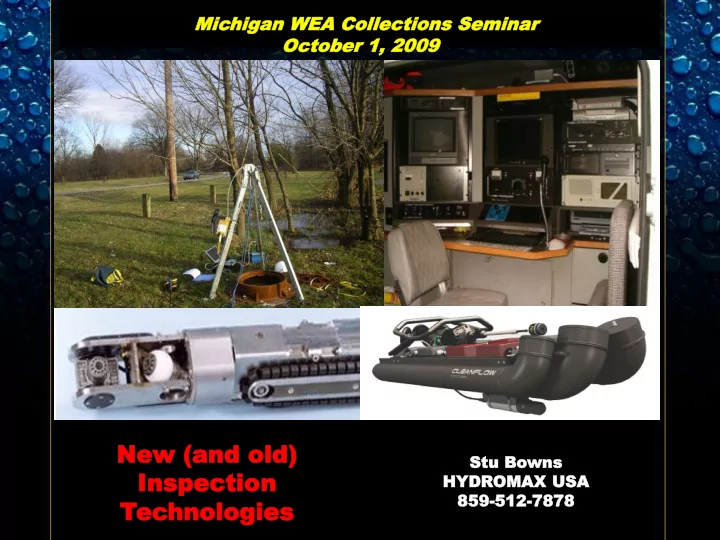
SLIDE 1 Stu B Stu Bowns ns HYD HYDROM OMAX USA USA 859 859-512 512-7878 7878
Mi Michigan WEA Collect higan WEA Collections ions Seminar Seminar Octobe October r 1, 20 1, 2009 09
New New (an (and d old)
Insp Inspec ecti tion
Tec echn hnolog
ies
SLIDE 2
History
low Met Metering ring
Zoom Came Camera ras s (Manh (Manhole Insp
ection tions) s)
Focu cused sed El Elec ectro trode de Le Leak ak Lo Loca cation tion (FELL (FELL)
CCTV In Insp spection tion
Late tera ral In l Inspe spect ction ion
Side de Scan Scan CCT CCTV
Larg rge Diamete e Diameter r Pi Pipe pe Insp Inspec ection tion (Came (Camera ra/L /Lase aser/ r/Sona Sonar) r)
Mic ichigan higan WE WEA A Collections Collections Sem emina inar October ctober 1, 1, 2009 2009
SLIDE 3 After we started sewer systems, the need for inspection and cleaning quickly arose. The beginning of sewer line inspection was not with CCTV, but rather a primitive test which was only really capable of finding infiltration or a failure of the so called inspection method. First holes used to access the collection systems were referred to as lamp holes. Only large enough to lower a lamp which was used to see if light would appear at the other end. Later years the candle was dragged from one manhole to another by floating a thin line, such as a fishing line downstream with the flow and then retrieving it at the downstream hole. The thread was used to allow the operator to later pull a sled or a wagon on which the candle was
- placed. It was felt that, if the candle would still be lit at the far end if there was not a problem
with the line. If infiltration occurred, then it was thought that the candle would be extinguished. This of course also remained true if the candle went past a lateral with flow, or rolled over during the inspection also. At the end of the day, the operator would have a simple set of data which showed if a line passed or failed. A failure usually meant a re-inspection. If an actual failure did indeed occur the operator still had no idea where in the line the infiltration occurred.
Lamp-hole Designs Source: The Designing, Construction, and Maintenance of Sewerage Systems, by H. Prescott Folwell, 1901
Source: www.sewerhistory.org
Mic ichigan higan WE WEA A Collections Collections Seminar eminar Octo ctober ber 1, 1, 200 2009
SLIDE 4 Source: www.sewerhistory.org
Mic ichigan higan WE WEA A Collections Collections Seminar eminar Octo ctober ber 1, 1, 200 2009
SLIDE 5
Mic ichigan higan WE WEA A Collections Collections Seminar eminar Octo ctober ber 1, 1, 200 2009
SLIDE 6
Mic ichigan higan WE WEA A Collections Collections Seminar eminar Octo ctober ber 1, 1, 200 2009
SLIDE 7 TECHNOLOGY TO CONSIDER
– Flume – Weir – Venturi
– Pressure transducer – Ultrasonic
– Doppler – Radar – Range gated doppler
WHAT, WHY , HOW ACCURATE, HOW LONG, WHO IS USING INFO
FL FLOW W METERI RING
SLIDE 8
FL FLOW W METERI RING
SLIDE 9 Even with the accuracy of today’s equipment and the ability to look at real time data, site visits are necessary to insure accurate data.
Flow Debris Depth Velocity Depth Flow (in) (FPS) (in) 3 2 Calculated 3.25 2 11% Low 3 2.25 13% Low 3 2 0.5 8% High 6 2 Calculated 6.25 2 4% Low 6 2.25 11% Low 6 2 0.5 3% High
8-inch Line
Flow Debris Depth Velocity Depth Flow (in) (FPS) (in) 4 2 Calculated 4.25 2 9% Low 4 2.25 13% Low 4 2 0.5 5% High 16 2 Calculated 16.25 2 2% Low 16 2.25 13% Low 16 2 0.5 1% High 22 2 Calculated 22.25 2 1% Low 22 2.25 9% Low 22 2 0.5 1% High
24-inch Line
FL FLOW W METERI RING
SLIDE 10
- Allows you to see up to 75 feet in
8” lines
- Can see more than 100 feet in
larger lines
- Helps determine if cleaning is
needed in association with Preventative Maintenance
- Helps prioritize where more
detailed inspection is necessary
ZOOM CAM CAMERAS RAS
SLIDE 11
- Acceptance testing for new sanitary sewers
- Identify pipe defects including potential sources of infiltration
and exfiltration (driven by flow monitoring data)
FE FELL LL SYSTEM
SLIDE 12
CCT CCTV V INSPECT CTION
SLIDE 13
CCT CCTV V INSPECT CTION
SLIDE 14
CCTV V INSPECT CTION
SLIDE 15
CCT CCTV V INSPECT CTION
SLIDE 16
Laterals comprise up to 50% of a municipalities collection system Faulty laterals can be significant sources of I/I Structural problems can lead to basement flooding and loss of service Locate cause of backups to determine financial responsibility Cross bores from other utilities
LA LATERAL RAL INSPECT CTIONS
Lateral camera is attached to a mainline camera Mainline camera used to position smaller lateral camera Lateral camera launched into the service line Mainlines can range from 8” to 48” Probe used in laterals from 3” to 6” View up to 80 feet in the lateral
SLIDE 17
LA LATERAL RAL INSPECT CTIONS
SLIDE 18
SIDE DE SCAN CAN INSPECT CTION
SLIDE 19 12-inch, Re-enforced Concrete “Un-wrapped” Side Scan Image Frontal view
- Frontal view identifies what appears to be a severely deteriorated
joint in need of repair
- The unwrapped side scan image identifies an intact joint with only
superficial surface defects. No repairs needed!
SIDE DE SCAN CAN INSPECT CTION
SLIDE 20
SIDE DE SCAN CAN INSPECT CTION
SLIDE 21
LAR LARGE DI DIAM AMETER P R PIPE INSPECT CTION
SLIDE 22 THE PROBLEMS:
- Illumination
- Image clarity
- Bypass pumping
- Personnel safety
- Data
LAR LARGE DI DIAM AMETER P R PIPE INSPECT CTION
SLIDE 23 ABOVE THE WATER SURFACE WITH LASER AND HIGH DEFINITION IMAGING
- Laser identifies loss of pipe wall from corrosion
- Laser calculates ovality
- Laser calculates deflection versus design
- HD Images
BELOW THE WATER SURFACE WITH SONAR
- Sonar determines lost capacity by calculating
debris levels and volumes
- Major structural anomalies
LAR LARGE DI DIAM AMETER P R PIPE INSPECT CTION
SLIDE 24 9 inches
Sonar of a 30-inch line
LAR LARGE DI DIAM AMETER P R PIPE INSPECT CTION
SLIDE 25
Each brick face can easily be seen and the mortar loss between each brick can be measured. 42” 32” Typical characteristics of an egg shaped brick sewer. Less mortar loss near the water level, getting worse towards the invert.
LAR LARGE DI DIAM AMETER P R PIPE INSPECT CTION
Below the water line in a brick sewer shows the resolution that is achievable with sonar.
SLIDE 26
The invert condition can be seen using sonar under the cctv camera.
LAR LARGE DI DIAM AMETER P R PIPE INSPECT CTION
SLIDE 27
Enables inspection with minimum lighting requirements Measurement of the exact shape of the conduit Locate and measure the magnitude & location of deformations Identification of connection location and position
LAR LARGE DI DIAM AMETER P R PIPE INSPECT CTION
SLIDE 28
LAR LARGE DI DIAM AMETER P R PIPE INSPECT CTION
SLIDE 29
LAR LARGE DI DIAM AMETER P R PIPE INSPECT CTION
SLIDE 30
LAR LARGE DI DIAM AMETER P R PIPE INSPECT CTION
SLIDE 31
- HD Image, Laser and Sonar data
continuously collected
- Sewers >30 inches in diameter
- Bypass pumping is not needed
- Capable of performing
continuous inspections for more than a mile
LAR LARGE DI DIAM AMETER P R PIPE INSPECT CTION
SLIDE 32
LAR LARGE DI DIAM AMETER P R PIPE INSPECT CTION
SLIDE 33
- Laser data collected 12x per second
- Sonar readings taken 1x per second
- HD Images captured 6x per second
LAR LARGE DI DIAM AMETER P R PIPE INSPECT CTION
SLIDE 34
LAR LARGE DI DIAM AMETER P R PIPE INSPECT CTION
SLIDE 35
LAR LARGE DI DIAM AMETER P R PIPE INSPECT CTION
SLIDE 36
LAR LARGE DI DIAM AMETER P R PIPE INSPECT CTION
SLIDE 37
LAR LARGE DI DIAM AMETER P R PIPE INSPECT CTION
SLIDE 38
WHAT’S NEXT
A SENSOR THAT CAN IMAGE OUTSIDE THE PIPE WALL TO IDENTIFY VOIDS AND PIPE THICKNESS
SLIDE 39
- There are numerous technologies used to
investigate the collection system
- No one tool identifies all the problems
- New and emerging technologies are available to
provide better data
Mic ichigan higan WE WEA A Collections Collections Sem emina inar October ctober 1, 1, 2009 2009
THANK YOU – QUESTIONS? Stu.Bowns@HydromaxUSA.COM