
SLIDE 1
David A Gutman1, Lee A.D. Cooper1, Joel Saltz1, Adam Flanders2, Dan Brat 1 and the TCGA Glioma Phenotype Research Group
Emory University1, Thomas Jefferson University2
Neuroimaging Predictors of Survival, Pathology and Molecular - - PowerPoint PPT Presentation
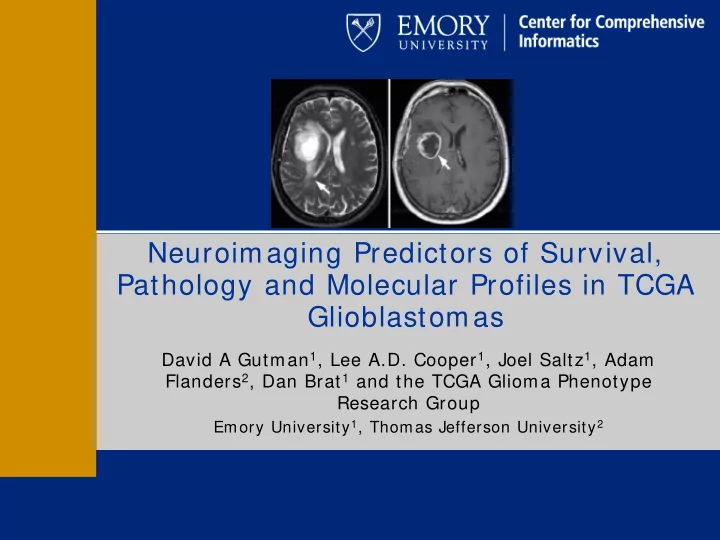
Neuroimaging Predictors of Survival, Pathology and Molecular Profiles in TCGA Glioblastomas David A Gutman 1 , Lee A.D. Cooper 1 , Joel Saltz 1 , Adam Flanders 2 , Dan Brat 1 and the TCGA Glioma Phenotype Research Group Emory University 1 ,
David A Gutman1, Lee A.D. Cooper1, Joel Saltz1, Adam Flanders2, Dan Brat 1 and the TCGA Glioma Phenotype Research Group
Emory University1, Thomas Jefferson University2
histology radiology clincal\pathology
molecular
primary brain tumor
– 500 patients from participating hospitals – mRNA transcription, CGH, sequence, DNA methylation – Neuroimaging – Whole slide pathology images
– Small tumor adjacent to motor area (e.g. eloquent cortex) has vastly different outcome than a small tumor in frontal lobe
Neuroimaging Feature p value Edema 0.48 Contrast Enhancing Tumor 0.004 Necrosis 0.37 Non-contrast Enhancing Tumor 0.83
Variable
Hazard Ratio (95% Confidence Limits) p value Karn Score
0.955 (0.933, 0.978) 0.0001
Contrast Enhancing Tumor
06-33% vs 0-5% 0.528 (0.196, 1.425) 0.025 34-95% vs 0-5% 1.446 (0.485, 4.312)
Do tumor genotypes “look” different?
From Verhaak 2010
< 5% Enhancement
– Increase sample size (in progress) – Move from ordinal assessments (0-5% , 6-33% , 34- 67% ) to continuous based assessments of tumor compartments (e.g. volumetrics) – More sophisticated feature extraction to include texture/ size/ location and voxel-based assessments
Emory University: Lee Cooper, Doris Gao, Tarun D Aurora, Williiam Dunn Jr, Scott N Hwang, Chad A Holder, Dima Hammoud, Carlos Moreno, Arun Krishnan, Seena Dehkharghani, Joel Saltz, Dan Brat Thomas Jefferson: Adam Flanders Henry Ford: Lisa Scarpace, Rajan Jain , Tom Mikkelsen SAIC-Frederick: John Freymann, Justin Kirby Boston University: Carl Jaffe NCI: Erich Huang, Bob Clifford UVA: Max Wintermark, Prashant Raghavan Brigham & Womens, Harvard: Rivka Colen Northwestern University: Pat Mongkolwat The TCGA Glioma Research Group If you have imaging data for TCGA contributed cases available and would like to contribute, please contact kirbyju@mail.nih.gov (Justin Kirby) or John Freymann (john freymannj@mail.nih.gov ) as we can help with deidentification and sharing
This work was supported in part with funds from the Georgia Cancer Coalition and the NCI funded In Silico Brain Tumor Research Center funded