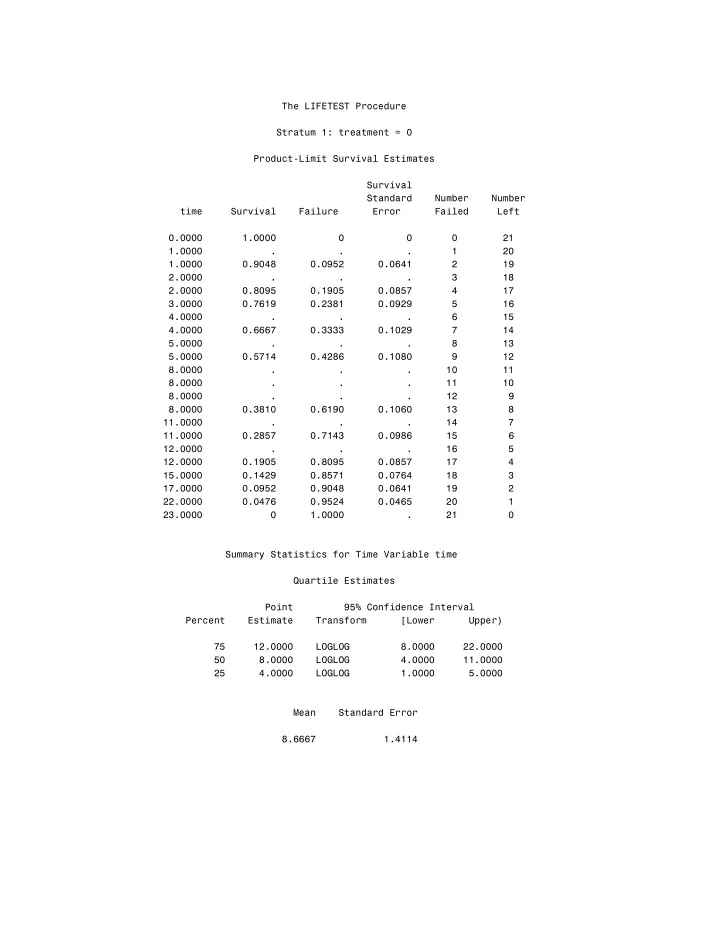

The LIFETEST Procedure Stratum 1: treatment = 0 Product-Limit Survival Estimates Survival Standard Number Number time Survival Failure Error Failed Left 0.0000 1.0000 0 0 0 21 1.0000 . . . 1 20 1.0000 0.9048 0.0952 0.0641 2 19 2.0000 . . . 3 18 2.0000 0.8095 0.1905 0.0857 4 17 3.0000 0.7619 0.2381 0.0929 5 16 4.0000 . . . 6 15 4.0000 0.6667 0.3333 0.1029 7 14 5.0000 . . . 8 13 5.0000 0.5714 0.4286 0.1080 9 12 8.0000 . . . 10 11 8.0000 . . . 11 10 8.0000 . . . 12 9 8.0000 0.3810 0.6190 0.1060 13 8 11.0000 . . . 14 7 11.0000 0.2857 0.7143 0.0986 15 6 12.0000 . . . 16 5 12.0000 0.1905 0.8095 0.0857 17 4 15.0000 0.1429 0.8571 0.0764 18 3 17.0000 0.0952 0.9048 0.0641 19 2 22.0000 0.0476 0.9524 0.0465 20 1 23.0000 0 1.0000 . 21 0 Summary Statistics for Time Variable time Quartile Estimates Point 95% Confidence Interval Percent Estimate Transform [Lower Upper) 75 12.0000 LOGLOG 8.0000 22.0000 50 8.0000 LOGLOG 4.0000 11.0000 25 4.0000 LOGLOG 1.0000 5.0000 Mean Standard Error 8.6667 1.4114