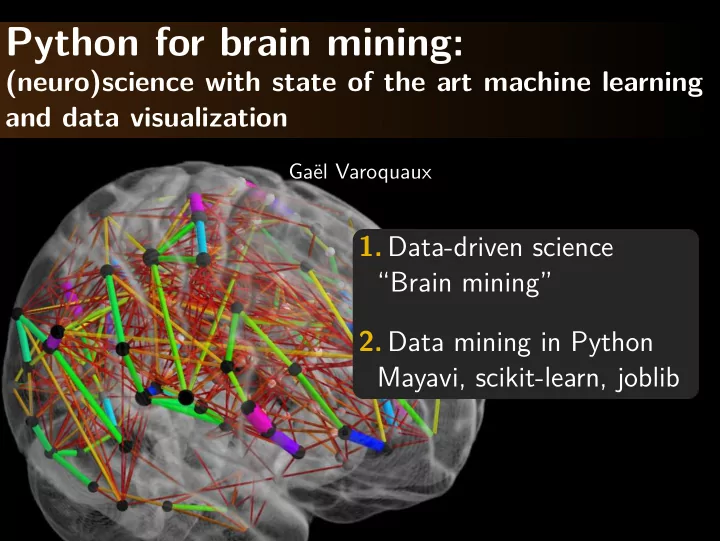
SLIDE 1 Python for brain mining:
(neuro)science with state of the art machine learning and data visualization
Ga¨ el Varoquaux
“Brain mining”
Mayavi, scikit-learn, joblib
SLIDE 2
1 Brain mining
Learning models of brain function
Ga¨ el Varoquaux 2
SLIDE 3
1 Imaging neuroscience
Brain images Models of function
Cognitive tasks
Ga¨ el Varoquaux 3
SLIDE 4
1 Imaging neuroscience
Brain images Models of function
Cognitive tasks
Data-driven science i ∂ ∂tΨ = HΨ
Ga¨ el Varoquaux 3
SLIDE 5
1 Brain functional data Rich data 50 000 voxels per frame Complex underlying dynamics Few observations ∼ 100 Drawing scientific conclusions? Ill-posed statistical problem
Ga¨ el Varoquaux 4
SLIDE 6
1 Brain functional data Rich data 50 000 voxels per frame Complex underlying dynamics Few observations ∼ 100 Drawing scientific conclusions? Ill-posed statistical problem
Modern complex system studies: from strong hypothesizes to rich data
Ga¨ el Varoquaux 4
SLIDE 7
1 Statistics: the curse of dimensionality y function of x1
Ga¨ el Varoquaux 5
SLIDE 8
1 Statistics: the curse of dimensionality y function of x1 y function of x1 and x2 More fit parameters? ⇒ need exponentially more data
Ga¨ el Varoquaux 5
SLIDE 9
1 Statistics: the curse of dimensionality y function of x1 y function of x1 and x2 More fit parameters? ⇒ need exponentially more data y function of 50 000 voxels? Expert knowledge (pick the right ones) Machine learning
Ga¨ el Varoquaux 5
SLIDE 10
1 Brain reading Predict from brain images the object viewed Correlation analysis
Ga¨ el Varoquaux 6
SLIDE 11
1 Brain reading Predict from brain images the object viewed
Inverse problem
Observations Spatial code
Correlation analysis
Inject prior: regularize
Sparse regression = compressive sensing
Ga¨ el Varoquaux 6
SLIDE 12
1 Brain reading Predict from brain images the object viewed
Inverse problem
Observations Spatial code
Correlation analysis
Inject prior: regularize
Extract brain regions Total variation regression
[Michel, Trans Med Imag 2011] Ga¨ el Varoquaux 6
SLIDE 13
1 Brain reading Predict from brain images the object viewed
Inverse problem
Observations Spatial code
Correlation analysis
Inject prior: regularize
Extract brain regions Total variation regression
[Michel, Trans Med Imag 2011]
Cast the problem in a prediction task: supervised learning. Prediction is a model-selection metric
Ga¨ el Varoquaux 6
SLIDE 14
1 On-going/spontaneous activity 95% of the activity is unrelated to task
Ga¨ el Varoquaux 7
SLIDE 15
1 Learning regions from spontaneous activity Multi-subject dictionary learning
Spatial map Time series
Sparsity + spatial continuity + spatial variability
⇒ Individual maps + functional regions atlas
[Varoquaux, Inf Proc Med Imag 2011] Ga¨ el Varoquaux 8
SLIDE 16
1 Graphical models: interactions between regions Estimate covariance structure Many parameters to learn Regularize: conditional independence = sparsity on inverse covariance
[Varoquaux NIPS 2010] Ga¨ el Varoquaux 9
SLIDE 17
1 Graphical models: interactions between regions Estimate covariance structure Many parameters to learn Regularize: conditional independence = sparsity on inverse covariance
[Varoquaux NIPS 2010]
Find structure via a density estimation: unsupervised learning. Model selection: likelihood of new data
Ga¨ el Varoquaux 9
SLIDE 18
2 My data-science software stack
Mayavi, scikit-learn, joblib
Ga¨ el Varoquaux 10
SLIDE 19
2 Mayavi: 3D data visualization Requirements large 3D data interactive visualization easy scripting Solution VTK: C++ data visualization UI (traits) + pylab-inspired API Black-box solutions don’t yield new intuitions Limitations hard to install clunky & complex C++ leaking through 3D visualization doesn’t pay in academia Tragedy of the commons or niche product?
Ga¨ el Varoquaux 11
SLIDE 20
2 scikit-learn: statistical learning Vision Address non-machine-learning experts Simplify but don’t dumb down Performance: be state of the art Ease of installation
Ga¨ el Varoquaux 12
SLIDE 21
2 scikit-learn: statistical learning Technical choices Prefer Python or Cython, focus on readability Documentation and examples are paramount Little object-oriented design. Opt for simplicity Prefer algorithms to framework Code quality: consistency and testing
Ga¨ el Varoquaux 13
SLIDE 22
2 scikit-learn: statistical learning API Inputs are numpy arrays Learn a model from the data: estimator.fit(X train, Y train) Predict using learned model estimator.predict(X test) Test goodness of fit estimator.score(X test, y test) Apply change of representation estimator.transform(X, y)
Ga¨ el Varoquaux 14
SLIDE 23 2 scikit-learn: statistical learning Computational performance scikit-learn mlpy pybrain pymvpa mdp shogun SVM 5.2 9.47 17.5 11.52 40.48 5.63 LARS 1.17 105.3
73.7
0.57 1.41
0.58 1.36 PCA 0.18
0.47 0.33 k-Means 1.34 0.79 ∞
0.68 Algorithms rather than low-level optimization convex optimization + machine learning Avoid memory copies
Ga¨ el Varoquaux 15
SLIDE 24
2 scikit-learn: statistical learning Community 35 contributors since 2008, 103 github forks 25 contributors in latest release (3 months span) Why this success? Trendy topic? Low barrier of entry Friendly and very skilled mailing list Credit to people
Ga¨ el Varoquaux 16
SLIDE 25
2 joblib: Python functions on steroids We keep recomputing the same things Nested loops with overlapping sub-problems Varying parameters I/O Standard solution: pipelines Challenges Dependencies modeling Parameter tracking
Ga¨ el Varoquaux 17
SLIDE 26
2 joblib: Python functions on steroids Philosophy Simple don’t change your code Minimal no dependencies Performant big data Robust never fail joblib’s solution = lazy recomputation: Take an MD5 hash of function arguments, Store outputs to disk
Ga¨ el Varoquaux 18
SLIDE 27 2 joblib Lazy recomputing
>>> from j o b l i b import Memory >>> mem = Memory( c a c h e d i r =’/tmp/joblib ’) >>> import numpy as np >>> a = np. vander (np. arange (3)) >>> s q u a r e = mem. cache (np. s q u a r e ) >>> b = s q u a r e (a) [Memory] C a l l i n g s q u a r e ... s q u a r e ( a r r a y ([[0 , 0, 1], [1, 1, 1], [4, 2, 1]])) s q u a r e
>>> c = s q u a r e (a) >>> # No recomputation
Ga¨ el Varoquaux 19
SLIDE 28
Conclusion Data-driven science will need machine learning because of the curse of dimensionality Scikit-learn and joblib: focus on large-data performance and easy of use Cannot develop software and science separately
Ga¨ el Varoquaux 20