
SLIDE 1
1
Network Visualization
Presented by
Shahed
Introduction
3
Introduction
- Basic building blocks
– Node – Links (relationship between nodes) – Spatial information – Network data
4
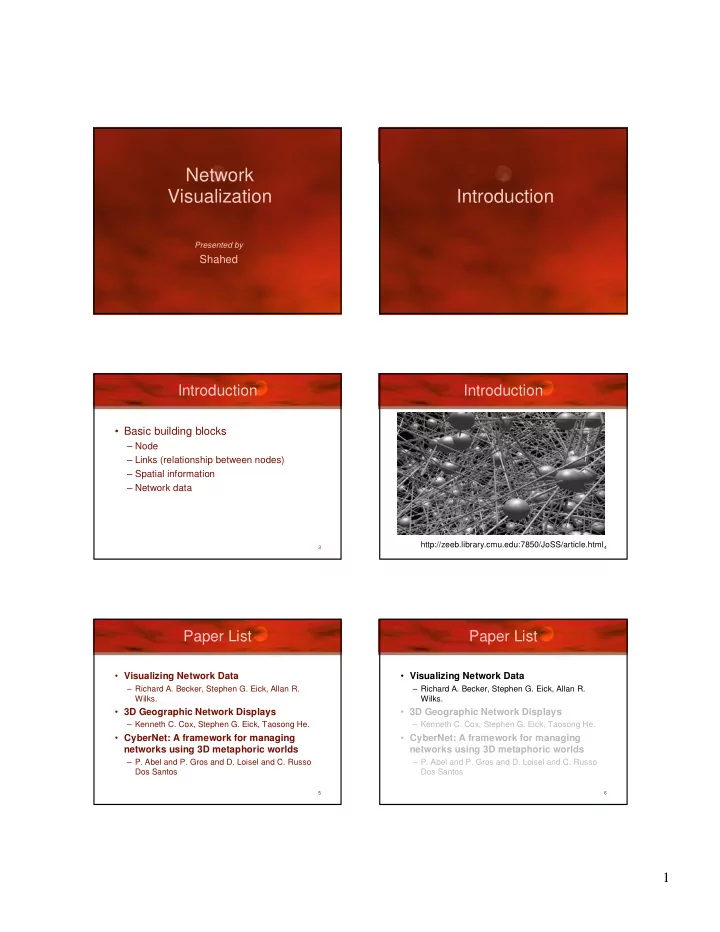
Introduction
http://zeeb.library.cmu.edu:7850/JoSS/article.html
5
Paper List
- Visualizing Network Data
– Richard A. Becker, Stephen G. Eick, Allan R. Wilks.
- 3D Geographic Network Displays
– Kenneth C. Cox, Stephen G. Eick, Taosong He.
- CyberNet: A framework for managing
networks using 3D metaphoric worlds
– P. Abel and P. Gros and D. Loisel and C. Russo Dos Santos
6
Paper List
- Visualizing Network Data
– Richard A. Becker, Stephen G. Eick, Allan R. Wilks.
- 3D Geographic Network Displays
– Kenneth C. Cox, Stephen G. Eick, Taosong He.
- CyberNet: A framework for managing
networks using 3D metaphoric worlds
– P. Abel and P. Gros and D. Loisel and C. Russo Dos Santos