MRSA in Mediterranean Mediterranean MRSA in countries countries - - PowerPoint PPT Presentation

mrsa in mediterranean mediterranean mrsa in countries
SMART_READER_LITE
LIVE PREVIEW

MRSA in Mediterranean Mediterranean MRSA in countries countries - - PowerPoint PPT Presentation

MRSA in Mediterranean Mediterranean MRSA in countries countries A. Pascual MD, PhD. University of Sevilla. Spain Proportion of of MRSA in MRSA in participating participating countries countries Proportion in 2005. EARSS in 2005. EARSS


slide-1
SLIDE 1

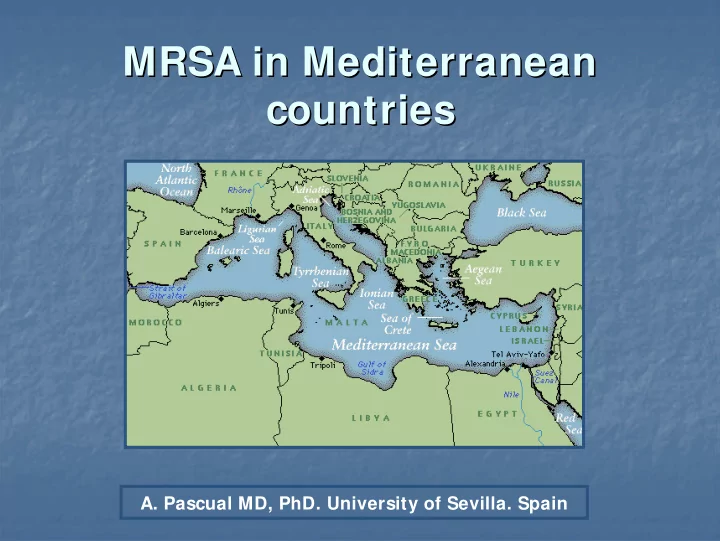
MRSA in MRSA in Mediterranean Mediterranean countries countries

  • A. Pascual MD, PhD. University of Sevilla. Spain
slide-2
SLIDE 2

Proportion Proportion of

  • f MRSA in

MRSA in participating participating countries countries in 2005. EARSS in 2005. EARSS

slide-3
SLIDE 3

Antibiotic Antibiotic Resistance Resistance Surveillance Surveillance and and Control in Control in the the Mediterraneam Mediterraneam Region Region ( ( ARMed ARMed Project) Project)

MA Borg et al. Eurosurveilance. Jul-Sept 2006

slide-4
SLIDE 4

Potential Potential repercussions repercussions of

  • f high

high levels levels of

  • f

Methicillin Methicillin resistance resistance in in southern southern and and eastern eastern mediterranean mediterranean countries countries

  • Direct

Direct repercussions repercussions for for the the mediterranean mediterranean countries countries. .

  • I mportation

I mportation ( ( and and spread spread?) ?) of

  • f

multiresistant multiresistant microorganisms microorganisms to to european european hospitals hospitals: :

  • Tourism

Tourism

  • Migration

Migration

MA Borg et al. Eurosurveilance. Jul-Sept 2006

slide-5
SLIDE 5

1.- Galicia, Asturias, Cantabria 2.- P. Vasco, Navarra, Rioja 3.- Cataluña 4.- Valencia, Murcia, Baleares 5.- Madrid 6.- Aragón, Castilla - La Mancha 7.- Castilla - León, Extremadura 8.- Andalucía, Ceuta, Melilla 9.- Canarias

3 20 20 14 14 13 13 24 24 17 17 16 16 22 22 13 13 4 4

Prevalence Prevalence of

  • f MRSA in

MRSA in Spain

  • Spain. 1986

. 1986-

  • 2006

2006 Participating Participating centers centers. . 1 1-

  • day

day study study

143 143 Hospitals Hospitals

Cercenado E. et al. Rev Clin Esp 1997 Cuevas O. et al. AAC 2004

slide-6
SLIDE 6

5 10 15 20 25 30 35 40 45 50

  • S. aureus (%)

SARM SARM 1,5 11,2 16,6 17,9 31,2 29 1986 1991 1994 1996 2002 2006*

Cercenado E. et al. Rev Clin Esp 1997 Cuevas O. et al AAC 2004 * Preliminar data (E. Cercenado)

slide-7
SLIDE 7

Prevalence Prevalence of

  • f MRSA by

MRSA by Regions Regions. . Spain

  • Spain. 2002

. 2002

31 % 31 %

33 % 33 % 33 % 31 % 31 % 31 % 16 % 16 % 16 % 24 % 24 % 24 % 21 % 21 % 21 % 55 % 55 % 55 % 36 % 36 % 36 % 31 % 31 % 31 % 0 % 7 cepas 0 % 0 % 7 cepas 7 cepas

Cercenado E. et al. Rev Clin Esp 1997 Cuevas O. et al. AAC 2004

slide-8
SLIDE 8

MRSA control MRSA control measures measures in in Spain Spain. . Project SARM 2003 GEI H/ GEMARA/ REI PI Project SARM 2003 GEI H/ GEMARA/ REI PI

  • Survey

Survey to to 61 61 hospitals hospitals (16 (16 million million inhabitants inhabitants) )

  • 81.7%

81.7% had had an an specific specific MRSA control MRSA control program program. .

  • I nfection

I nfection control control practitioners practitioners

  • >

> 1 nurse/ 250 1 nurse/ 250 beds beds: 46% . : 46% .

  • I solation

I solation precautions precautions with with all all MRSA MRSA patients patients: : 95% 95%

  • Use

Use of

  • f mupirocin

mupirocin to to descolonize descolonize all all patients patients: 54% : 54%

  • High

High variability variability in in measures measures and and interpretation interpretation of

  • f

the the epidemiological epidemiological situation situation. .

  • A. Millán et al. Enferm Infecc Microbiol Clin. 2006
slide-9
SLIDE 9

Control Control of

  • f endemic

endemic nosocomial nosocomial methicillin methicillin-

  • resistant

resistant S.

  • S. aureus

aureus: : relevance relevance of

  • f active

active surveillance surveillance and and colonized colonized health health care care workers workers. .

  • J. Rodr
  • J. Rodrí

íguez guez-

  • Ba

Bañ ño

  • and

and A. Pascual.

  • A. Pascual.

University University Hospital Virgen Hospital Virgen

  • Macarena. Sevilla.
  • Macarena. Sevilla. Spain

Spain. .

Submitted

slide-10
SLIDE 10

Hospital characteristics Hospital characteristics

  • Regional University hospital: 1000 beds.

Regional University hospital: 1000 beds.

  • Medical and surgical acute patients

Medical and surgical acute patients

  • I CUs

I CUs

  • General:

General: 30 30 beds beds

  • Heart

Heart surgery surgery: 15 : 15 beds beds

  • Surgical

Surgical: 6 : 6 beds beds

  • Neonatal

Neonatal unit unit and and paediatric paediatric I CU I CU

slide-11
SLIDE 11

MRSA: background MRSA: background

  • E

End nde emic mic from from 1990. 1990.

  • 1995

1995-

  • 1997

1997: : 45 45-

  • 50%

50% of

  • f S.
  • S. aureus

aureus were were MRSA. MRSA.

  • Cases in

Cases in all all services services. .

  • A control program was designed

A control program was designed

slide-12
SLIDE 12

Epidemiological Epidemiological investigation investigation and and pre pre-

  • intervention

intervention situation situation. .

  • January

January 1998. 1998.

  • Epidemiological

Epidemiological investigation investigation

  • I mplementation of contact precautions:

I mplementation of contact precautions:

  • Reinforcement

Reinforcement of

  • f hand

hand hygiene hygiene. .

  • Patients

Patients in individual in individual rooms rooms or

  • r in

in cohorts cohorts ( ( open

  • pen structure

structure). ).

  • Contact

Contact precautions precautions reinforced reinforced by by infection infection control control practicioner practicioner. .

  • Strict

Strict cleaning cleaning policy policy and and desinfectation desinfectation of

  • f

devices devices. .

slide-13
SLIDE 13

Active Active surveillance surveillance period period ( ( Period Period A) A)

  • January

January 1999 (no 1999 (no changes changes). ). All All previous previous plus: plus:

  • Units

Units > 1 > 1 attributable attributable case case from from the the previous previous period period: :

  • Screening

Screening of

  • f patients

patients admitted admitted to to these these wards wards. .

  • Screening

Screening of

  • f HCW

HCW of

  • f these

these units units. .

  • Screening

Screening of

  • f roommates

roommates of

  • f patients

patients with with MRSA in MRSA in wards wards not not subjet subjet to to active active surveillance surveillance. .

  • Treatment of colonized patients

Treatment of colonized patients (nasal (nasal mupirocin mupirocin) ) except except: : open

  • pen wounds

wounds, , respiratory respiratory tract tract colonization colonization, , mechanical mechanical ventilation ventilation, , nasogastric nasogastric tube tube, , urinary urinary colonization colonization ( ( catheterized catheterized patients patients), ), invasive invasive MRSA MRSA infection infection and and high high level level mupirocin mupirocin resistance resistance. .

slide-14
SLIDE 14

Extended control period Extended control period (Period B) (Period B)

  • January

January 2000.

  • 2000. All

All previous previous plus: plus:

  • Screening

Screening patients patients admitted admitted from from other

  • ther health

health care care facilities facilities and and readmitted readmitted colonized colonized patients patients. .

  • Re

Re-

  • evaluation

evaluation of

  • f patients

patients that that had had not not been been candidates candidates for for decolonization decolonization during during hospitalization hospitalization. .

  • Follow

Follow up up of

  • f colonized

colonized patients patients after after discharge discharge. .

  • Alcohol

Alcohol solution solution dispensers dispensers in in all all rooms rooms. .

slide-15
SLIDE 15

Patients Patients (1997 (1997-

  • 2003)

2003)

  • MRSA

MRSA isolated isolated in 523 in 523 patients patients: :

  • 29% : medical

29% : medical service service

  • 33% :

33% : surgical surgical service service

  • 37% :

37% : I CUs I CUs

  • MRSA

MRSA infections infections in 390 in 390 patients patients (75% ): (75% ):

  • 38% : SSTI

38% : SSTI

  • 26% : RTI

26% : RTI

  • 26% :

26% : Primary Primary bacteremia bacteremia

  • 14% : Vascular

14% : Vascular catheter catheter infection infection

  • 10% :

10% : Other Other infections infections

  • Crude

Crude mortality mortality rate rate: 41% : 41%

slide-16
SLIDE 16

Evolution Evolution of

  • f MRSA

MRSA during during the the 3 3 periods periods. .

I ncidence rates expressed as new cases per 1.000 patient-day

Pre Pre-

  • intervention

intervention period period (1997 (1997-

  • 1998)

1998) Post Post-

  • intervention

intervention period A period A (1999) (1999) Post Post-

  • intervention

intervention period B period B (2000 (2000-

  • 2003)

2003) Incidence rate of colonization or Incidence rate of colonization or infection due to MRSA infection due to MRSA

0.59 0.59 0.46 0.46a

a

0.12 0.12a

a

Percentage of Percentage of methicillin methicillin resistance resistance among among S.

  • S. aureus

aureus (range) (range)

47 (46 47 (46-

  • 48)

48) 35 35a

a

11.5 (8 11.5 (8-

  • 15)

15)a

a

Incidence rate of Incidence rate of bacteremia bacteremia due to due to MRSA MRSA

0.10 0.10 0.06 0.06b

b

0.02 0.02a

a

Percentage of colonized patients Percentage of colonized patients detected by active surveillance detected by active surveillance

3.1 3.1 5.9 5.9b

b

13.5 13.5c

c

  • No. of health care workers
  • No. of health care workers

colonized by MRSA colonized by MRSA

10 10 12 12

  • No. of detected MRSA
  • No. of detected MRSA-
  • colonized

colonized patients admitted from other patients admitted from other hospitals hospitals

2 2 13 13

P values with respect to period A: aP < 0.0001; bP = 0.2; cP = 0.01

slide-17
SLIDE 17

Monthly rates of Monthly rates of methicillin methicillin-

  • resistant

resistant Staphylococcus Staphylococcus aureus aureus colonization or infection. The arrow indicates the colonization or infection. The arrow indicates the implementation if the intervention. implementation if the intervention.

0,1 0,2 0,3 0,4 0,5 0,6 0,7 0,8 0,9 1997 1998 1999 2000 2001 2002 2003 Months Cases per 1,000 patient-day

slide-18
SLIDE 18

Yearly Yearly evolution evolution of

  • f the

the incidence incidence rates rates of

  • f

bacteremia bacteremia due due to to MSSA ( MSSA ( grey grey column column), MRSA ), MRSA ( ( white white column column) ) and and colonization colonization/ / infection infection due due to to MRSA ( MRSA ( line line) )

0,02 0,04 0,06 0,08 0,1 0,12 1997 1998 1999 2000 2001 2002 2003 Cases of bacteremia per 1,000 hospital-day 0,1 0,2 0,3 0,4 0,5 0,6 0,7 Cases of MRSA colonization/infection per 1,000 hospita days

slide-19
SLIDE 19

Microbiological Microbiological Results Results

  • PFGE

PFGE was was performed performed in 138 in 138 isolates isolates: :

  • 91

91 from from blood blood cultures (86% cultures (86% of

  • f bloodstream

bloodstream infections infections). ).

  • 31

31 from from screening screening (62% (62% of

  • f all

all patients patients in active in active surveillance surveillance) )

  • 16

16 from from HCW (73% HCW (73% of

  • f colonized

colonized HCW). HCW).

  • 13

13 clonal clonal groups groups: :

  • Clon A: 109

Clon A: 109 isolates isolates; 79% (12 ; 79% (12 subtypes subtypes) )

  • All

All isolates isolates from from HCW HCW same same clonal clonal group group than than one

  • ne or
  • r several

several patients patients admitted admitted in in their their wards wards. .

  • 12

12 Resistance Resistance profiles profiles (RP) (RP)

  • RP2 (R

RP2 (R only

  • nly to

to Ciprofloxacin Ciprofloxacin): 35% ): 35%

  • RP8 (R

RP8 (R to to ciprofloxacin ciprofloxacin, , erythromycin erythromycin and and clindamycin clindamycin): 37% ): 37%

slide-20
SLIDE 20

Evolution Evolution of

  • f MRSA cases

MRSA cases after after detection detection and and decolonization decolonization ( ( arrows arrows) ) of

  • f HCW in

HCW in some some wards wards. .

5 10 15 20 25 30 1997 1998 1999 2000 2001 2002 2003

Internal Medicine A

2 4 6 8 10 12 1997 1998 1999 2000 2001 2002 2003

Nephrology

2 4 6 8 1997 1998 1999 2000 2001 2002 2003

Urology

2 4 6 8 10 12 1997 1998 1999 2000 2001 2002 2003

Traumatology A

5 10 15 20 25 30 1997 1998 1999 2000 2001 2002 2003

General surgery B

10 20 30 40 50 60 70 1997 1998 1999 2000 2001 2002 2003

General ICU

slide-21
SLIDE 21

Antimicrobial consumption during the study period. Antimicrobial consumption during the study period.

Data for Data for betalactams betalactams are on a different scale. are on a different scale.

5 10 15 20 25 30 35 40 45 50 1997 1998 1999 2000 2001 2002 2003 DDD per 1,000 patient-days (aminoglycosides vancomycin, fluoroquinolones) 50 100 150 200 250 300 DDD per 1,000 patient-days (betalactams

Aminoglycosides Vancomycin Fluoroquinolones Betalactams

slide-22
SLIDE 22

Limitations Limitations of

  • f the

the study study

  • Limitations

Limitations of

  • f quasi

quasi experimental experimental studies studies. .

  • We

We could could not not investigate investigate the the specific specific effects effects of

  • f all

all the the control control measures measures implemented implemented ( ( all all were were complementary complementary). ).

  • Our

Our results results might might not not be be applicable applicable to to different different epidemiological epidemiological situations situations. .

slide-23
SLIDE 23

Conclusions Conclusions

  • MRSA

MRSA rates rates are are very very high high in in most most of

  • f

Mediterranean Mediterranean countries countries with with important important differences differences among among them them. .

  • Control

Control of

  • f endemic

endemic MRSA MRSA is is possible possible even even in in big big hospitals hospitals by by implementation implementation of

  • f

comprehensive comprehensive control control programs programs including including active active surveillance surveillance of

  • f patiens

patiens and and…… ……..HCW! ..HCW!

slide-24
SLIDE 24

Another Another conclusion conclusion… …. .

  • MRSA

MRSA is is not not transmitted transmitted by sea by sea water water (so (so far far). ). I t I t means means that that this this problem problem is is not not due due to to Mediterranean Mediterranean Sea Sea but but to to the the people people who who live live in in countries countries around around it it!!!! !!!!