
MAIN SCREEN Matt Bartucci1, David Marchand2, Antonis Nanakoudis3 and Rui Chen1, 1Thermo Fisher Scientific, Madison, WI, USA, 2Nanoscience Instruments, Phoenix, AZ, USA, 3Thermo Fisher Scientific, Eindhoven, The Netherlands
Morphological and chemical characterization of a non-woven fiber using electron and infrared microscopy
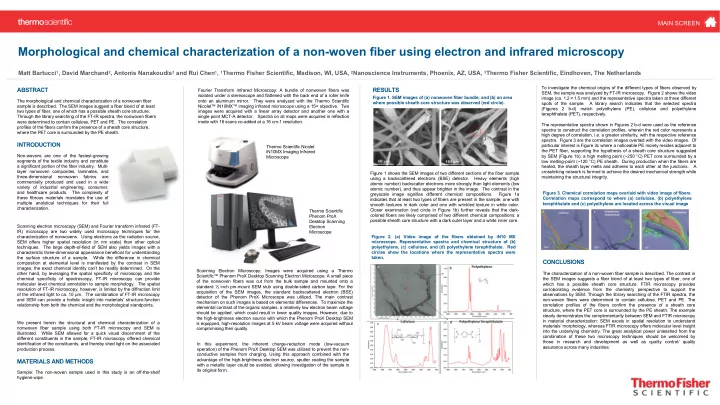
To investigate the chemical origins of the different types of fibers observed by SEM, the sample was analyzed by FT-IR microscopy. Figure 2 shows the video image (ca. 1.2×1.5 mm) and the representative spectra taken at three different spots of the sample. A library search indicates that the selected spectra (Figures 2 b-d) match polyethylene (PE), cellulose and polyethylene terephthalate (PET), respectively.
ABSTRACT
The morphological and chemical characterization of a nonwoven fiber sample is described. The SEM images suggest a fiber blend of at least two types of fiber, one of which has a possible sheath core structure. Through the library searching of the FT-IR spectra, the nonwoven fibers were determined to contain cellulose, PET and PE. The correlation profiles of the fibers confirm the presence of a sheath core structure, where the PET core is surrounded by the PE sheath.
CONCLUSIONS
The characterization of a non-woven fiber sample is described. The contrast in the SEM images suggests a fiber blend of at least two types of fiber, one of which has a possible sheath core structure. FTIR microscopy provides corroborating evidence from the chemistry perspective to support the
- bservations by SEM. Through the library searching of the FTIR spectra, the
non-woven fibers were determined to contain cellulose, PET and PE. The correlation profiles of the fibers confirm the presence of a sheath core structure, where the PET core is surrounded by the PE sheath. The example clearly demonstrates the complementarity between SEM and FTIR microscopy in material characterization: SEM excels in spatial resolution to understand materials’ morphology, whereas FTIR microscopy offers molecular level insight into the underlying chemistry. The great analytical power unleashed from the combination of these two microscopy techniques should be welcomed by those in research and development as well as quality control/ quality assurance across many industries. Figure 2. (a) Video image of the fibers obtained by iN10 MX
- microscope. Representative spectra and chemical structure of (b)
polyethylene, (c) cellulose, and (d) polyethylene terephthalate. Red circles show the locations where the representative spectra were taken. Figure 1 shows the SEM images of two different sections of the fiber sample using a backscattered electrons (BSE) detector. Heavy elements (high atomic number) backscatter electrons more strongly than light elements (low atomic number), and thus appear brighter in the image. The contrast in the greyscale image signifies different chemical compositions. Figure 1a indicates that at least two types of fibers are present in the sample: one with smooth textures in dark color and one with wrinkled texture in white color. Closer examination (red circle in Figure 1b) further reveals that the dark- colored fibers are likely comprised of two different chemical compositions: a possible sheath core structure with a dark outer layer and a white inner core. Figure 3. Chemical correlation maps overlaid with video image of fibers. Correlation maps correspond to where (a) cellulose, (b) polyethylene terephthalate and (c) polyethylene are located across the visual image The representative spectra shown in Figures 2 b-d were used as the reference spectra to construct the correlation profiles, wherein the red color represents a high degree of correlation, i.e. a greater similarity, with the respective reference
- spectra. Figure 3 are the correlation images overlaid with the video images. Of
particular interest is Figure 3c where a noticeable PE moiety resides adjacent to the PET fiber, supporting the hypothesis of a sheath core structure suggested by SEM (Figure 1b): a high melting point (~250 °C) PET core surrounded by a low melting-point (~120 °C) PE sheath. During production when the fibers are heated, the sheath layer melts and adheres to each other at the junctions. A crosslinking network is formed to achieve the desired mechanical strength while maintaining the structural integrity.
INTRODUCTION
Non-wovens are one of the fastest-growing segments of the textile industry and constitute a significant portion of the fiber industry. Multi- layer nonwoven composites, laminates, and three-dimensional nonwoven fabrics are commercially produced and used in a wide variety of industrial engineering, consumer, and healthcare products. The complexity of these fibrous materials mandates the use of multiple analytical techniques for their full characterization. Scanning electron microscopy (SEM) and Fourier transform infrared (FT- IR) microscopy are two widely used microscopy techniques for the characterization of nonwovens. Using electrons as the radiation source, SEM offers higher spatial resolution (in nm scale) than other optical techniques. The large depth-of-field of SEM also yields images with a characteristic three-dimensional appearance beneficial for understanding the surface structure of a sample. While the difference in chemical composition at elemental level is manifested by the contrast in SEM images, the exact chemical identity can’t be readily determined. On the
- ther hand, by leveraging the spatial specificity of microscopy and the
chemical specificity of spectroscopy, FT-IR microscopy can provide molecular level chemical annotation to sample morphology. The spatial resolution of FT-IR microscopy, however, is limited by the diffraction limit
- f the infrared light to ca. 10 μm. The combination of FT-IR microscopy
and SEM can provide a holistic insight into materials’ structure-function relationship from both the chemical and the morphological standpoints. We present herein the structural and chemical characterization of a nonwoven fiber sample using both FT-IR microscopy and SEM is illustrated. While SEM allowed for a quick visual discernment of the different constituents in the sample, FT-IR microscopy offered chemical identification of the constituents, and thereby shed light on the associated production process. Fourier Transform Infrared Microscopy: A bundle of nonwoven fibers was isolated under a stereoscope and flattened with the back end of a roller knife
- nto an aluminum mirror.
They were analyzed with the Thermo Scientific Nicolet™ iN10MX™ imaging infrared microscope using a 15× objective. Two images were acquired with a linear array detector and another one with a single point MCT-A detector. Spectra on all maps were acquired in reflection mode with 16 scans co-added at a 16 cm-1 resolution. Scanning Electron Microscopy: Images were acquired using a Thermo Scientific™ Phenom ProX Desktop Scanning Electron Microscope. A small piece
- f the nonwoven fibers was cut from the bulk sample and mounted onto a
standard ½ inch pin-mount SEM stub using double-sided carbon tape. For the acquisition of the SEM images, the standard backscattered electron (BSE) detector of the Phenom ProX Microscope was utilized. The main contrast mechanism on such images is based on elemental differences. To maximize the elemental contrast of the organic samples, a relatively low electron beam voltage should be applied, which could result in lower quality images. However, due to the high-brightness electron source with which the Phenom ProX Desktop SEM is equipped, high-resolution images at 5 kV beam voltage were acquired without compromising their quality. In this experiment, the inherent charge-reduction mode (low-vacuum
- peration) of the Phenom ProX Desktop SEM was utilized to prevent the non-
conductive samples from charging. Using this approach combined with the advantage of the high-brightness electron source, sputter coating the sample with a metallic layer could be avoided, allowing investigation of the sample in its original form.
MATERIALS AND METHODS
Sample: The non-woven sample used in this study is an off-the-shelf hygiene wipe.
RESULTS
Figure 1. SEM images of (a) nonwoven fiber bundle; and (b) an area where possible sheath core structure was observed (red circle). Thermo Scientific Nicolet iN10MX Imaging Infrared Microscope Thermo Scientific Phenom ProX Desktop Scanning Electron Microscope