Monte Ca rlo Ana lysis of Monte Ca rlo Ana lysis of Unc e rta - - PowerPoint PPT Presentation

monte ca rlo ana lysis of monte ca rlo ana lysis of unc e
SMART_READER_LITE
LIVE PREVIEW

Monte Ca rlo Ana lysis of Monte Ca rlo Ana lysis of Unc e rta - - PowerPoint PPT Presentation

Monte Ca rlo Ana lysis of Monte Ca rlo Ana lysis of Unc e rta intie s in the Ne the rla nds Unc e rta intie s in the Ne the rla nds NIR for 1990- - 2004 2004 NIR for 1990 Je roe n va n de r Sluijs (UU) Andre a Ra mire z Ra mire z (UU)


slide-1
SLIDE 1

Copernicus Institute Sustainable Development and Innovation http://www.chem.uu.nl/nws/www/publica/publicaties2006/E2006-58.pdf

Monte Ca rlo Ana lysis of Monte Ca rlo Ana lysis of Unc e rta intie s in the Ne the rla nds Unc e rta intie s in the Ne the rla nds NIR for 1990 NIR for 1990-

  • 2004

2004

Je roe n va n de r Sluijs (UU) Andre a Ra mire z Ra mire z (UU) Corry de Ke itze r (UU) Jos O livie r (MNP) L a ure ns Bra nde s (MNP)

Se pte mbe r 27-28, 2007

slide-2
SLIDE 2

Copernicus Institute Sustainable Development and Innovation http://www.chem.uu.nl/nws/www/publica/publicaties2006/E2006-58.pdf

Conte nts Conte nts

Go a ls o f the re se a rc h Ma in me tho do lo g ic a l po ints Re sults a nd c o nc lusio ns

slide-3
SLIDE 3

Copernicus Institute Sustainable Development and Innovation http://www.chem.uu.nl/nws/www/publica/publicaties2006/E2006-58.pdf

GOALS GOALS

Asse ss whe the r a Mo nte Ca rlo a na lysis o f the unc e rta intie s in the Dutc h NI R wo uld re sult in diffe re nt le ve ls o f unc e rta intie s c o mpa re d to tho se pro vide d b y the T ie r 1 a na lysis. Asse ss whic h pa ra me te rs c o ntrib ute the mo st to the to ta l unc e rta inty in the e missio ns, in o rde r to ide ntify a re a s o f hig h prio rity fo r the furthe r impro ve me nt o f the

  • ve ra ll a c c ura c y o f the inve nto ry.
slide-4
SLIDE 4

Copernicus Institute Sustainable Development and Innovation http://www.chem.uu.nl/nws/www/publica/publicaties2006/E2006-58.pdf

METHOD METHOD

Ana lysis pe rfo rme d fo r the K yo to b a se ye a r (1990/ 1995) a nd fo r 2004 Ba sic da ta fo r the c a lc ula tio ns o b ta ine d fro m NL NI R Sa me le ve l o f a g g re g a tio n c ho se n a s in NL T ie r 1 a na lysis

slide-5
SLIDE 5

Copernicus Institute Sustainable Development and Innovation http://www.chem.uu.nl/nws/www/publica/publicaties2006/E2006-58.pdf

For base case For base case

All kno wn no n-Ga ussia n distrib utio n we re ta ke n into a c c o unt No rma l distrib utio n a ssume d whe re sta nda rd de via tio n e q ua l o r b e lo w 30% L

  • g no rma l whe re sta nda rd

de via tio n > 30% I n so me c a se s, no rma l distrib utio ns ha ve b e e n trunc a te d (0,+inf)

slide-6
SLIDE 6

Copernicus Institute Sustainable Development and Innovation http://www.chem.uu.nl/nws/www/publica/publicaties2006/E2006-58.pdf

So ftwa re pa c ka g e use d: @ Risk PDF s fo r e missio n fa c to rs a nd a c tivity da ta we re b a se d o n unc e rta inty ra ng e s use d in T I E R 1 a nd e xpe rt judg me nt fro m MNP. All kno wn c o rre la tio ns we re ta ke n into a c c o unt

slide-7
SLIDE 7

Copernicus Institute Sustainable Development and Innovation http://www.chem.uu.nl/nws/www/publica/publicaties2006/E2006-58.pdf

CO RREL AT IO NS CO RREL AT IO NS

100% F OR

ACT I VI T Y DAT A: F OR T HE SAME YE AR AND DI F F E RE NT E MI SSI ON F ACT ORS SAME E MI SSI ON F ACT OR DI F F E RE NT SE CT ORS AND/ OR DI F F E RE NT YE ARS

slide-8
SLIDE 8

Copernicus Institute Sustainable Development and Innovation http://www.chem.uu.nl/nws/www/publica/publicaties2006/E2006-58.pdf

slide-9
SLIDE 9

Copernicus Institute Sustainable Development and Innovation http://www.chem.uu.nl/nws/www/publica/publicaties2006/E2006-58.pdf

PARTIAL CORRELATIONS

F OR E MI SSI ON F ACT ORS F ROM SAME CAT E GORY AMONG YE ARS:

slide-10
SLIDE 10

Copernicus Institute Sustainable Development and Innovation http://www.chem.uu.nl/nws/www/publica/publicaties2006/E2006-58.pdf

slide-11
SLIDE 11

Copernicus Institute Sustainable Development and Innovation http://www.chem.uu.nl/nws/www/publica/publicaties2006/E2006-58.pdf

PARTIAL CORRELATIONS

F

  • r e missio n fa c to rs fro m sa me

c a te g o rie s a mo ng ye a rs F

  • r so me a c tivity da ta a c ro ss se c to rs

(e .g ., g a s c o nsumptio n in c he mic a l industry in c a te g o ry 1A a nd c he mic a l fe e dsto c k in c a te g o ry 2) Ac tivity da ta a mo ng ye a rs c o nside re d inde pe nde nt (CORR=0), E xc e ptio n: E missio ns fro m L a ndfill wa ste

slide-12
SLIDE 12

Copernicus Institute Sustainable Development and Innovation http://www.chem.uu.nl/nws/www/publica/publicaties2006/E2006-58.pdf

Following the IPCC Tier 2 method, uncertainties in the trend emissions were calculated in absolute and in relative terms. A pedigree assessment was carried out for the most sensitive emissions factors and activity data to systematically assess strengths and weakness in the knowledge base (part of the NUSAP system).

slide-13
SLIDE 13

Copernicus Institute Sustainable Development and Innovation http://www.chem.uu.nl/nws/www/publica/publicaties2006/E2006-58.pdf

Pe dig re e ma trix

Source: Risbey et al., 2001

slide-14
SLIDE 14

Copernicus Institute Sustainable Development and Innovation http://www.chem.uu.nl/nws/www/publica/publicaties2006/E2006-58.pdf

Re sults Re sults

slide-15
SLIDE 15

Copernicus Institute Sustainable Development and Innovation http://www.chem.uu.nl/nws/www/publica/publicaties2006/E2006-58.pdf

Tier 1: 1990: 213 Tg CO2eq 2004: 217 Tg CO2eq std: 4.5% (6%)

T

  • ta l G HG e missions in the Ne the rla nds

T

  • ta l G HG e missions in the Ne the rla nds

Without L UCF Without L UCF

1990

Mean = 214434.4 X <=205692.83 2.5% X <=227374.2 97.5% 1 2 3 4 5 6 7 8 9 190 218 245 273 300

Values in Thousands Values in 10^ -5 2004

Mean = 217211.1 X <=226654.06 97.5% X <=210429.5 2.5% 0.0 0.2 0.4 0.6 0.8 1.0 1.2 200 220 240 260 280

Values in Thousands Values in 10^ -4

Monte Carlo analysis-: 1990: 214 Tg CO2eq 2004: 217 Tg CO2eq std: 5.3 % (1990); 3.9% (2004) 1990 2004

slide-16
SLIDE 16

Copernicus Institute Sustainable Development and Innovation http://www.chem.uu.nl/nws/www/publica/publicaties2006/E2006-58.pdf

Tier 1: Relative change: 1.6% std: 3.3%

Trend in Total GHG emissions Trend in Total GHG emissions

Monte Carlo analysis: Relative change: 1.3% std: 4.5%

Without LUCF

Mean = 2776.677 X <=-7650.37 2.5% X <=11529.15 97.5%

1 2 3 4 5 6 7 8 9

  • 80
  • 60
  • 40
  • 20

20 40

Values in Thousands Values in 10^ -5

slide-17
SLIDE 17

Copernicus Institute Sustainable Development and Innovation http://www.chem.uu.nl/nws/www/publica/publicaties2006/E2006-58.pdf

Year Minimum Maximum Mean Mode Std Deviation Variance Skewness Kurtosis 1990 154120.8 164436.3 158974.5 158297.1 1199.3 1438225.0 0.043 2.986 2004 173637.8 185306.1 179516.0 177994.8 1318.0 1737040.0 0.034 3.011

1990

Mean = 158974.5 X <=161351.22 97.5% X <=156659.83 2.5%

0.0 0.5 1.0 1.5 2.0 2.5 3.0 3.5 154 158 162 166

Values in Thousands Values in 10^ -4 2004

Mean = 179516

X <=182112.19 97.5% X <=176954.98 2.5% 0.0 0.5 1.0 1.5 2.0 2.5 3.0 3.5 172 176 179 183 186

Values in Thousands Values in 10^ -4

Tier 1: 1990: 159 Tg CO2eq 2004: 179 Tg CO2eq std: 2.5% (5%)

Total CO Total CO2

2 emissions

emissions Without LUCF Without LUCF

Monte Carlo analysis 1990: 159 Tg CO2eq 2004: 180 Tg CO2eq std: 1.5 % (1990 & 2004) 1990 2004

slide-18
SLIDE 18

Copernicus Institute Sustainable Development and Innovation http://www.chem.uu.nl/nws/www/publica/publicaties2006/E2006-58.pdf

Tier 1: Relative change: 9.6% std: 2.1%

Trend in Total CO Trend in Total CO2

2 emissions

emissions Without LUCF Without LUCF

Monte Carlo analysis: Relative change: 9.6% std: 1.6%

M ean = 20541.49 X < =23579.72 97.5% X < = 17501.92 2.5%

0.0 0.5 1.0 1.5 2.0 2.5 3.0 12 16 20 24 28

V alues in T housands Values in 10^ -4

slide-19
SLIDE 19

Copernicus Institute Sustainable Development and Innovation http://www.chem.uu.nl/nws/www/publica/publicaties2006/E2006-58.pdf

Year M inimum M aximum M ean M

  • de

Std Deviation Variance Skewness Kurtosis 1990 16889.97 38036.09 25463.84 25716.46 2381.692 5672456 0.4433465 3.979612 2004 12807.72 29766.56 17444.48 17203.42 1315.159 1729642 0.3799421 3.685013

1990

Mean = 25463.84 X <=30988.2 97.5% X <=21042.94 2.5%

0.0 0.2 0.4 0.6 0.8 1.0 1.2 1.4 1.6 1.8 2.0 15 21 28 34 40

Values in Thousands Values in 10^ -4 2004

Mean = 17444.48 X <=20236.8 97.5% X <=15068.76 2.5%

0.0 0.5 1.0 1.5 2.0 2.5 3.0 3.5 12 18 24 30

Values in Thousands Values in 10^ -4

Tier 1: 1990: 25.4 Tg CO2eq 2004: 17.5 Tg CO2eq std: 18% (25%)

Total CH Total CH4

4 emissions

emissions

Monte Carlo analysis -: 1990: 25.5 Tg CO2eq 2004: 17.4 Tg CO2eq std: 18.7 % (1990); 15.1% (2004) 1990 2004

slide-20
SLIDE 20

Copernicus Institute Sustainable Development and Innovation http://www.chem.uu.nl/nws/www/publica/publicaties2006/E2006-58.pdf

Tier 1: Relative change: -3.7% std: 1.4%

Trend in Total CH Trend in Total CH4

4 emissions

emissions

Monte Carlo analysis Relative change: -3.7% std: 2.2%

Mean = -8019.355 X <=-3370.86 97.5% X <=-13540.66 2.5% 0.0 0.2 0.4 0.6 0.8 1.0 1.2 1.4 1.6 1.8

  • 20
  • 15
  • 10
  • 5

5

Values in Thousands Values in 10^ -4

slide-21
SLIDE 21

Copernicus Institute Sustainable Development and Innovation http://www.chem.uu.nl/nws/www/publica/publicaties2006/E2006-58.pdf

Year M inim um M axim um M ean M

  • de

Std D eviation Variance Skew ness Kurtosis 1990 8511.8 100122.1 21261.6 20106.1 4907.0 24078210.0 2.343 16.888 2004 8085.4 79178.2 17999.0 19580.3 3780.6 14292880.0 2.006 14.693

1990

M ean = 21261.55 X <=33232.12 97.5% X <=14650.43 2.5%

0.0 0.2 0.4 0.6 0.8 1.0 1.2 28 55 83 110

Values in Thousands Values in 10^ -4 2004

M ean = 17998.98 X <=26813.37 97.5% X <=12535.62 2.5%

0.0 0.2 0.4 0.6 0.8 1.0 1.2 1.4 20 40 60 80

Values in Thousands Values in 10^ -4

Tier 1: 1990: 21.2 Tg CO2eq 2004: 18.0 Tg CO2eq std: 45% (50%)

Total N Total N2

2O emissions

O emissions Without LUCF Without LUCF

Monte Carlo analysis: 1990: 21.3 Tg CO2eq 2004: 18.0 Tg CO2eq std: 46.2 % (1990); 42.0% (2004) 1990 2004

slide-22
SLIDE 22

Copernicus Institute Sustainable Development and Innovation http://www.chem.uu.nl/nws/www/publica/publicaties2006/E2006-58.pdf

Tier 1: Relative change: -1.5% std: 2.0%

Trend in Total N Trend in Total N2

2O emissions

O emissions Without LUCF Without LUCF

Monte Carlo analysis: Relative change: -1.5% std: 3.4%

Mean = -3262.571 X <=-11899.73 2.5% X <=3144.66 97.5%

0.0 0.2 0.4 0.6 0.8 1.0 1.2 1.4

  • 80
  • 60
  • 40
  • 20

20

Values in Thousands Values in 10^ -4

slide-23
SLIDE 23

Copernicus Institute Sustainable Development and Innovation http://www.chem.uu.nl/nws/www/publica/publicaties2006/E2006-58.pdf

Y e a r M in im u m M a x im u m M e a n M

  • d

e S td D e via tio n V a ria n ce S ke w n e ss K u rto sis 1 9 9 5 6 4 .3 5 7 1 1 5 3 4 .3 6 8 7 3 4 .5 2 8 6 9 1 4 .6 1 1 9 2 .5 4 9 3 8 4 7 4 1 1 .1 .2 8 9 2 1 7 9 2 .4 6 6 6 8 1 2 4 9 4 1 .1 6 6 3 5 8 7 .0 1 3 2 2 5 1 .6 4 1 2 3 .9 5 3 1 6 .4 5 3 8 1 1 4 3

.0 1 2 5 4 7 4 2 .9 9 3 7 8 9

1 9 9 5

M ea n = 8 73 4.5 2 8 X < = 1 6 2 1 .54 9 7.5% X < = 7 1 5 1 .33 2 .5 %

.0 .5 1 .0 1 .5 2 .0 2 .5 3 .0 3 .5 4 .0 4 .5 6 8 1 1 2

V a lu e s in T h

  • u

sa n d s Values in 10^ -4 2 4

M e an = 22 51 .6 41 X < = 2 86 8.0 4 97 .5% X < = 1 62 9.7 2.5%

.0 .2 .4 .6 .8 1 .0 1 .2 1 .4 .5 1 .4 2 .3 3 .1 4 .0

V a lu e s in T h

  • u

sa n d s Values in 10^ -3

Tier 1: 1995: 8.25 Tg CO2eq 2004: 2.24 Tg CO2eq std: 28% (50% Jos)

Total F Total F-

  • emissions

emissions

Monte Carlo analysis 1995: 8.7 Tg CO2eq 2004: 2.25 Tg CO2eq std: 21.1 % (1990); 28.1% (2004) 1995 2004

slide-24
SLIDE 24

Copernicus Institute Sustainable Development and Innovation http://www.chem.uu.nl/nws/www/publica/publicaties2006/E2006-58.pdf

Tier 1: Relative change: -2.8% std: 0.4 %

Trend in Total F Trend in Total F-

  • gas emissions

gas emissions

Monte Carlo analysis: Relative change: -3.0% std: 0.9%

Mean = -6482.887 X <=-4778.3 97.5% X <=-8473.99 2.5% 0.0 0.5 1.0 1.5 2.0 2.5 3.0 3.5 4.0 4.5

  • 10.0
  • 8.3
  • 6.5
  • 4.8
  • 3.0

Values in Thousands Values in 10^ -4

slide-25
SLIDE 25

Copernicus Institute Sustainable Development and Innovation http://www.chem.uu.nl/nws/www/publica/publicaties2006/E2006-58.pdf

Re sulting unc e rta intie s a re in the sa me

  • rde r o f ma g nitude a s tho se o b ta ine d in

the T I E R-1 F

  • r the NL

inve nto ry, a c c o unting fo r c o rre la tio ns ha s a la rg e r impa c t o n the re sults fo r the tre nd tha n o n the unc e rta inty in the to ta l GHG e missio ns Ac c o unting fo r c o rre la tio ns a nd a symme tric a l distrib utio ns (in ste a d o f using NL T I E R 1 a ssumptio ns) did no t le a d to ra dic a lly diffe re nt unc e rta inty in to ta l GHG e missio ns.

slide-26
SLIDE 26

Copernicus Institute Sustainable Development and Innovation http://www.chem.uu.nl/nws/www/publica/publicaties2006/E2006-58.pdf

Unc e rta inty a ssumptio ns in the NL a re we ll in the ra ng e o f E uro pe a n Studie s Re sulting unc e rta inty in the to ta l Dutc h GHG e missio ns is in the lo we r ra ng e →sha re o f CO 2 e missio ns is hig he r → CO 2 e missio n fa c to rs a re re la tive ly we ll unde rsto o d a nd mo nito re d → lo we r unc e rta intie s

slide-27
SLIDE 27

Copernicus Institute Sustainable Development and Innovation http://www.chem.uu.nl/nws/www/publica/publicaties2006/E2006-58.pdf

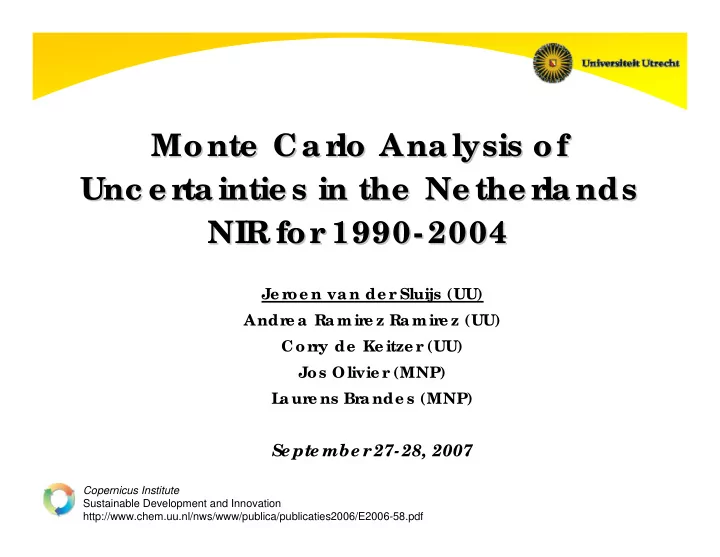
Regression Sensitivity for TOTAL EMISSIONS NETHERLANDS 2...

Std b Coefficients

Gaseous Fuels / RISK/C88 .095 Coke Oven and BF gas / RIS.../F30 .106 NE / NO/K62 .108 NCV / RISK/D38 .114 NCV / RISK/F38 .114 Diesel Oil / NO/C195 .115 Volatized N from fertilize.../F103 .116

  • 1. Cattle / RISK/G8

.134 NA / RISK/J71 .154 N from fertilizers, animal.../D104 .165

  • 1. Cattle / RISK/K48

.168 Nitrogen input from applic.../F94 .17 1 Managed Waste Disposal .../H8 .185

  • 2. Nitric Acid Production.../J25

.332 Nitrogen input from manure.../F95 .334 N from fertilizers, animal.../F104 .654

  • 1
  • 0.75
  • 0.5
  • 0.25

0.25 0.5 0.75 1

Nitrogen Leaching agr. soils IEF N2O Nitrogen input from manure applied to soils IEF N2O Nitric Acid Production IEF N2O Managed Waste Disposal on Land; CH4 emission Nitrogen input from synthetic fertilizers, IEF N2O Manure management; Cattle IEF CH4 Nitrogen Leaching agr. soils, AD Indirect N2O from NO2 comb.& ind. processes EF N2O Enteric Fermentation; 1. Cattle IEF CH4 Volatized N from fertilizers IEF N2O Road Transportation; Diesel Oil, aggregate AD Petroleum Refining; Liquid Fuels; aggregate AD Petroleum Refining; Liquid Fuels; IEF CO2 Coke Oven and BF gas IEF CO2

  • Manif. Ind. & Constr. Gaseous fuels, aggregate AD

Energy Industries gaseous fuels IEF CO2

Ranking of uncertain inputs according to their contribution in t Ranking of uncertain inputs according to their contribution in the variance he variance ( (Regression sensitivity base case no LUFC total 2004 GHG emission

Regression sensitivity base case no LUFC total 2004 GHG emission)

)

slide-28
SLIDE 28

Copernicus Institute Sustainable Development and Innovation http://www.chem.uu.nl/nws/www/publica/publicaties2006/E2006-58.pdf

Regression Sensitivity for Total Netherlands (CO2-eq.)/F94

Std b Coefficients

L

  • .104
  • 1. Cattle / RISK/G8

.117

  • 1. Ca
  • .144

N from fertilizers, animal.../D104 .144

  • 1. Cattle / RISK/K48

.146 Nitrogen input from applic.../F94 .149 1 Managed Waste Disposal .../H8 .16

  • .165

Nitrogen in

  • .177
  • .189

N from fe

  • .2

Nitrogen

  • .221

Nitrogen input from manure.../F95 .29 1 Managed

  • .421

N from fertilizers, animal.../F104 .551 N from fe

  • .77
  • 1
  • 0.75
  • 0.5
  • 0.25

0.25 0.5

Nitrogen Leaching agr. soils IEF N2O, 1990 Nitrogen Leaching agr. soils IEF N2O 2004 Managed Waste Disposal on Land; CH4 emission 1990 Managed Waste Disposal on Land; CH4 emission 2004 Nitrogen input from manure applied to soils IEF N2O 2004 Nitrogen input from manure applied to soils IEF N2O, 1990 Nitrogen input from synthetic fertilizers, IEF N2O 1990 Nitrogen input from synthetic fertilizers, IEF N2O 2004 Nitrogen Leaching agr. soils AD 1990 HFC-23, Effective EF 1990 Manure management; Cattle IEF CH4 1990 Manure management; Cattle IEF CH4 2004 Nitrogen Leaching agr. soils, AD 2004 Enteric Fermentation, Cattle; IEF CH4 1990 Enteric Fermentation, Cattle; IEF CH4 2004 Petroleum Refining; Liquid Fuels; aggregate AD

Regression sensitivity base case no LUFC, trend Regression sensitivity base case no LUFC, trend

slide-29
SLIDE 29

Copernicus Institute Sustainable Development and Innovation http://www.chem.uu.nl/nws/www/publica/publicaties2006/E2006-58.pdf

slide-30
SLIDE 30

Copernicus Institute Sustainable Development and Innovation http://www.chem.uu.nl/nws/www/publica/publicaties2006/E2006-58.pdf

slide-31
SLIDE 31

Copernicus Institute Sustainable Development and Innovation http://www.chem.uu.nl/nws/www/publica/publicaties2006/E2006-58.pdf

F ro m the dia g no stic dia g ra m: fo r the unc e rta inty in to ta l GHG e missio n impro ve me nts in o ur kno wle dg e o f the e missio n fa c to rs fo r c a te g o rie s indire c t N2O e missio ns fro m a g ric ultura l so ils, dire c t N2O e missio ns fro m a g ric ultura l so ils, indire c t N2O fro m c o mb ustio n a nd industria l pro c e sse s a nd e missio ns fro m ma nure ma na g e me nt mig ht b e g ive n the hig he st prio rity. I nspe c tio n o f the pe dig re e ta b le re ve a ls tha t the ma in pro b le m in the kno wle dg e b a se is in va lida tio n a nd e mpiric a l b a sis.

slide-32
SLIDE 32

Copernicus Institute Sustainable Development and Innovation http://www.chem.uu.nl/nws/www/publica/publicaties2006/E2006-58.pdf

the T ie r 1 a sse ssme nt c o uld a lso b e impro ve d b y:

  • a djusting the T

ie r 1 unc e rta inty inputs fo r la ndfills;

  • a djusting the T

ie r 1 unc e rta inty o f a c tivity da ta fo r fue l c o mb ustio n in the c o mme rc ia l se c to r a nd

  • re c o nside ring the T

ie r 1 unc e rta inty inputs fo r indire c t N2O e missio ns fro m a g ric ultura l so urc e s

slide-33
SLIDE 33

Copernicus Institute Sustainable Development and Innovation http://www.chem.uu.nl/nws/www/publica/publicaties2006/E2006-58.pdf

F

  • r future ye a rs, a s lo ng a s the e missio n mo de l

do e s no t c ha ng e sub sta ntia lly a nd the sha re o f CO 2 a nd no n-CO 2 g a se s is no t sub sta ntia lly diffe re nt fro m 2004, it se e ms justifie d to use T ie r 1 a s ma in me tho d fo r unc e rta inty a na lysis in the NI R. Ho we ve r, b e c a use o f o ng o ing e missio n re duc tio n e ffo rts a nd c ha ng e s o ve r time in the fue l mix a s we ll a s in the sha re s o f no n-CO 2 g re e nho use g a se s, we re c o mme nd re pe a ting the Mo nte Ca rlo a na lysis re g ula rly (e ve ry 4 ye a rs) a s pa rt o f the QA/ QC pro c e dure s.

slide-34
SLIDE 34

Copernicus Institute Sustainable Development and Innovation http://www.chem.uu.nl/nws/www/publica/publicaties2006/E2006-58.pdf

Grassland emission variability

  • 600
  • 400
  • 200

200 400 600 800 2002 2003 2004 2005 Year ΣNEE (gC m-2 a-1)

Haarweg Cabauw Horstermeer Leliestad Fochtelooerveen Haastrecht Oukoop Stein

(c)

Jacobs et al., WUR, 2007 ME1

Flux tower network:

  • average mineral soils:

Uptake 0.9 ton C/ha/yr

  • average organic soils:

Source 2.2 ton C/ha/yr

  • weighted average all Dutch

grasslands: Uptake 0.28 ton C/ha/yr NIR: drained organic soils Source 5.18 ton C/ha/yr x 223000 ha = Source of 4.2 Mton C Need for regionally specific and spatially explicit CO2 emission factors

Slide borrowed from Pavel Kabat WUR

slide-35
SLIDE 35

Copernicus Institute Sustainable Development and Innovation http://www.chem.uu.nl/nws/www/publica/publicaties2006/E2006-58.pdf

Inverse modelling: methane

Prior Post 2002 Prior Post 2002

1020 kT CH4 1350 kT CH4 Atmospheric verification suggests substantially higher CH4 emissions than reported:

  • Top-down (inversion): average

1641kT CH4 for yrs 2000-2006

  • Bottum-up (NIR): declining trend
  • 1211 Kt in 1990 decreasing to
  • 824 kT in 2004

Vermeulen, ECN, in prep ME2

Bottom-up 1995 Top-down 2002

Slide borrowed from Pavel Kabat WUR

slide-36
SLIDE 36

Copernicus Institute Sustainable Development and Innovation http://www.chem.uu.nl/nws/www/publica/publicaties2006/E2006-58.pdf

QUESTI ONS? QUESTI ONS? Full Full report dow nloadable from

report dow nloadable from w w w . w w w .jvds jvds. .nl nl Direct link: Direct link:

http:/ / w w w .chem . http:/ / w w w .chem .uu uu. .nl nl/ / nw s nw s/ w w w / / w w w / publica publica / publicaties2 0 0 6 / E2 0 0 6 / publicaties2 0 0 6 / E2 0 0 6 -

  • 5 8 .

5 8 .pdf pdf