MOL2NET, 2017 , 3, doi:10.3390/mol2net-03-xxxx 2 results of this - - PDF document

mol2net 2017 3 doi 10 3390 mol2net 03 xxxx 2 results of
SMART_READER_LITE
LIVE PREVIEW

MOL2NET, 2017 , 3, doi:10.3390/mol2net-03-xxxx 2 results of this - - PDF document

MOL2NET, 2017 , 3, doi:10.3390/mol2net-03-xxxx 1 MOL2NET, International Conference Series on Multidisciplinary Sciences MDPI http://sciforum.net/conference/mol2net-03 diPGA: Treatment of Type 2 Diabetes Mellitus with Adiponectin (ADN) Alexander


slide-1
SLIDE 1

MOL2NET, 2017, 3, doi:10.3390/mol2net-03-xxxx 1

MDPI

MOL2NET, International Conference Series on Multidisciplinary Sciences http://sciforum.net/conference/mol2net-03

diPGA: Treatment of Type 2 Diabetes Mellitus with Adiponectin (ADN)

Alexander Marquez (E-mail: amarquez11@u.westcoastuniversity.edu ) a, Melissa Cueto (E-mail: meCueto@westcoastuniversity.edu)b

a West Coast University b West Coast University

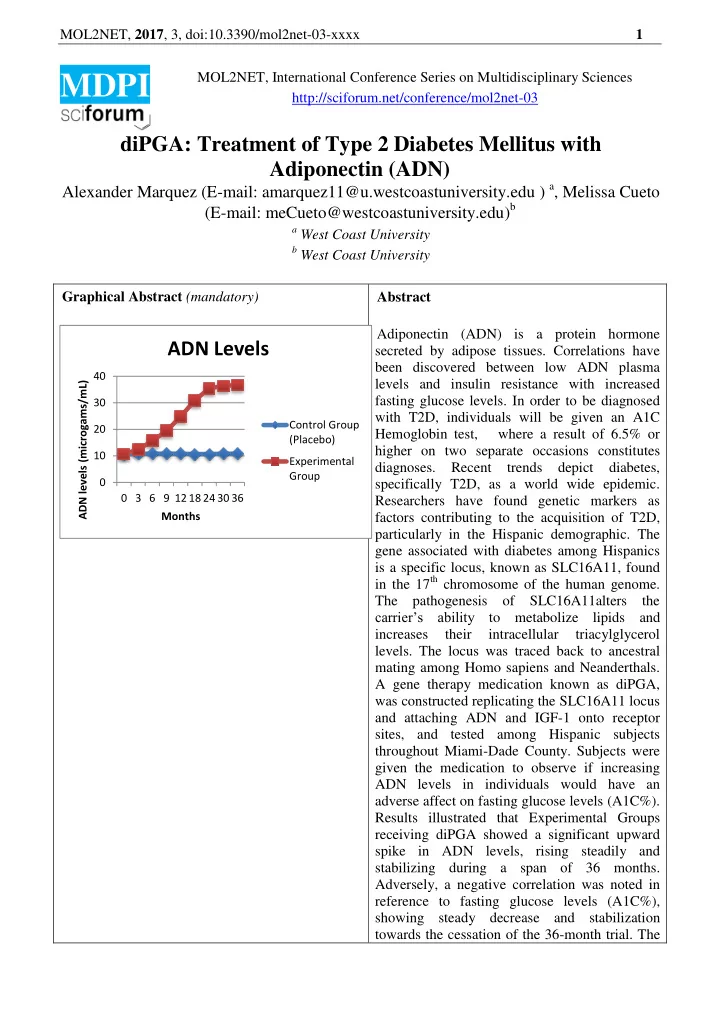
Graphical Abstract (mandatory) Abstract Adiponectin (ADN) is a protein hormone secreted by adipose tissues. Correlations have been discovered between low ADN plasma levels and insulin resistance with increased fasting glucose levels. In order to be diagnosed with T2D, individuals will be given an A1C Hemoglobin test, where a result of 6.5% or higher on two separate occasions constitutes diagnoses. Recent trends depict diabetes, specifically T2D, as a world wide epidemic. Researchers have found genetic markers as factors contributing to the acquisition of T2D, particularly in the Hispanic demographic. The gene associated with diabetes among Hispanics is a specific locus, known as SLC16A11, found in the 17th chromosome of the human genome. The pathogenesis of SLC16A11alters the carrier’s ability to metabolize lipids and increases their intracellular triacylglycerol

  • levels. The locus was traced back to ancestral

mating among Homo sapiens and Neanderthals. A gene therapy medication known as diPGA, was constructed replicating the SLC16A11 locus and attaching ADN and IGF-1 onto receptor sites, and tested among Hispanic subjects throughout Miami-Dade County. Subjects were given the medication to observe if increasing ADN levels in individuals would have an adverse affect on fasting glucose levels (A1C%). Results illustrated that Experimental Groups receiving diPGA showed a significant upward spike in ADN levels, rising steadily and stabilizing during a span of 36 months. Adversely, a negative correlation was noted in reference to fasting glucose levels (A1C%), showing steady decrease and stabilization towards the cessation of the 36-month trial. The

10 20 30 40 0 3 6 9 12 18 24 30 36 ADN levels (microgams/mL) Months

ADN Levels

Control Group (Placebo) Experimental Group

slide-2
SLIDE 2

MOL2NET, 2017, 3, doi:10.3390/mol2net-03-xxxx 2 results of this clinical trial raise implications that can positively impact the scientific, medical, and Hispanic communities worldwide if successfully replicated in future studies. Note: This paper was an assignment for a nursing school General Education Capstone

  • course. The student writer did not conduct a real

study; he rather simulated a study to demonstrate writing/research skills, creativity, scientific knowledge, and an understanding of how to generate and analyze data. The corresponding author is the student’s instructor, who guided the student on each section of the scientific paper, providing feedback on how to “conduct” the study and on how to revise the writing. Introduction Literature Review Type 2 Diabetes (T2D), has become a disease epidemic. As stated in 2015 by the American Diabetes Association (2017), approximately 30 million Americans have been diagnosed with diabetes and there are approximately 1.5 million new cases of diabetes each year. Diabetes is the seventh leading cause of death in the United States, killing approximately 80,000 Americans annually as of 2015, and it costs Americans an excess of $240 billion annually (American Diabetes Association, 2017). There are two types of diabetes that affect the majority of the population, and can often be confused: Type 1 and Type 2 diabetes. The Diabetes Teaching Center (n.d) at the University of California, San Francisco defines Type 2 Diabetes as a dually defective disease in which the body has resistance to insulin in combination with the inability of insulin production. T2D is the most common form of diabetes, making up 80 – 90% of the diabetic population (Diabetes Teaching Center at UCSF, n.d). In reference to pathogenesis, Copstead and Banasik (2013) characterize T2D by a relative systemic lack of insulin. The body’s tissues become hyperglycemic due to insulin resistance, increasing the amount of excess glucose in the bloodstream (Copstead & Banasik, 2013). This resistance causes tissues to biologically need more insulin than normally required to consume glucose and remain homeostatic (Copstead & Banasik, 2013). Both the liver and gastrointestinal tract are responsible for releasing glucose into the blood stream so it can systemically spread throughout the body (Copstead & Banasik, 2013). In particular, the liver is responsible for gluconeogenesis, which converts consumed sugar from foods and synthesizes it into glucose for the body to use as energy (Copstead & Banasik, 2013). Thereafter, the body, specifically the pancreas (organ responsible for insulin production) begins to compensate for the insulin resistance by creating larger quantities of insulin, hyperinsulimia; decomposition begins to occur when the Beta cells in the pancreas become dysfunctional which causes the pancreas to not produce enough insulin to metabolize the body’s glucose levels and overcome the insulin resistance (Copstead & Banasik, 2013). The insulin deficiency over a period of time leads to the acquisition of diabetes and glucose toxicity, thus granting the need of some sort of exogenous diabetic treatment (Copstead & Banasik, 2013). The correlation between Type 2 diabetes and dietary/lifestyle habits are well known, especially in association with high caloric Westernized eating habits consisting of high consumptions of red and/or processed meats, dairy products, high-sugar products, eggs, and refined grains (Zhao et al., 2017). Additionally, these Westernized eating habits increase risk factors such as Body Mass Index

slide-3
SLIDE 3

MOL2NET, 2017, 3, doi:10.3390/mol2net-03-xxxx 3 (BMI), physical inactivity, and waist /extremity circumference (Zhao et al, 2017). In their research Zhao et al. (2017) concluded that there is a significant association between family history (FHD) and T2D, where offspring of T2D diagnosed parents are more likely to suffer from the disease than others that do not (Zhao et al., 2017). There have been over 40 genetic risk variants that have recently been validated, thus showing a strong correlation between diagnoses and genetics passed on from genetic donors (Anderson et al., 2013). In order to be diagnosed with T2D, subjects will first be given a Glycated hemoglobin (A1C%) test, which indicates the mean blood glucose level over the past 60 – 90 days by measuring the percentage of blood glucose attached to hemoglobin (Mayo Clinic, 2017). A diagnosis of T2D warrants an A1C % level of greater than or equal to 6.5% on two separate testing occasions (Mayo Clinic, 2017). The most common treatment for T2D is healthy dieting, adequate physical activity, and

  • ral medication administration (Mayo Clinic, 2017). Metformin is the most commonly prescribed

medication for T2D and is typically considered as the first-line drug (Stuart, 2017). Stuart (2017) mentions that medication improves insulin sensitivity by inhibiting hepatic function, in turn regulating glucose uptake of the liver and skeletal muscle system. Adiponectin (ADN) is a protein hormone secreted by adipose tissue that circulates the blood in different molecular weighted forms (Kogan, et al., 2013). Structurally speaking, ADN is a protein consisting of 244 amino acids and can be distinguished by its N-terminal variance region, collagenous domain, and C-terminal globular domain (Orrù, et al., 2017). ADN is also known as an insulin- sensitizing adipokine that improves insulin sensitivity by stimulating glucose uptake and inhibiting gluconeogenesis (Mei, Jeong-Sook, & Chang-Seon, 2010). One of the crucial functions of Adiponectin is metabolizing glucose and lipids, while also demonstrating protective effects against insulin resistance and inflammation (Orrù et al., 2017). Additionally, ADN makes better usage of lipids and simple carbohydrates (Orrù et al., 2017). Adiponectin is prevalently abundant in plasma (normal range: 5- 30 μ/ mL), however according to Hotta et al. (2000), plasma levels of ADN are significantly lower in patients with T2D (as cited by Mei et al., 2010). ADN levels are 1.5 to 2 times higher in women than in men (Kogan et al., 2013). Furthermore, a linkage has been found between decreased ADN levels and insulin resistance, obesity, and other metabolic disorders (Orrù et al., 2017). Obese people have higher amounts of adipose tissues throughout the body, however they maintain low concentrations of AND throughout the abundant tissues; this is caused by inflammation of the adipose tissue, arbitrated by necrotic tumor factor alpha (suppressor of ADN) (Orrù et al., 2017). Moreover, after weight loss, adipose tissue functionality begins to improve and ADN levels begin to systemically increase across the body (Orrù et al., 2017). According to Yamauchi et al. (2001), ADN causes decreased resistance among mice by lowering amounts of triglycerides located in muscle and the liver by increasing molecular expression

  • f the molecules involved with fatty-acid combustion and energy dissipation (As cited by Mei et al,

2010). Furthermore, a study of Yamauchi et al. (2002) concluded that ADN activates 5’-AMP activated protein kinase (AMPK), which stimulates both glucose utilization and fatty-acid oxidation (As cited by Mei et al., 2010). ADN also prevents the progression of atherosclerosis in mice (Mei et al., 2010). It has been difficult to successfully deliver the ADN protein to targets by direct administration, thus researchers have diverted to genetic therapy as an alternative approach to ADN administration in mice (Mei et al., 2010). Insulin-like growth factor 1 (IGF-1) is a protein produced by the liver consisting of 70 amino acids and has various functions throughout the body, specifically muscle growth and insulin-like activities (Orrù et al., 2017). Recent studies provide evidence that shows ADN, IGF-1, and insulin share common pathways, demonstrating an interconnection to obesity and other metabolic diseases such as T2D (Orrù et al., 2017). In a study conducted by Harvard geneticist David Altshuler (n.d), evidence uncovered that humans acquired the diabetic gene mutation from Neanderthals, which is the first noted disease linkage to Homo sapiens’ ancestry (Doucleff, 2013). In the research Altshuler and his team tested DNA sequences of approximately 8,000 subjects that lived in Latin American countries and found a mixture

  • f European genetic markers among the subjects (Doucleff, 2013). Moreover, many known genes

already associated with diabetes were identified in the subjects; however another gene, which increased diabetes diagnoses of 20%, was identified. (Doucleff, 2013).

slide-4
SLIDE 4

MOL2NET, 2017, 3, doi:10.3390/mol2net-03-xxxx 4 The SIGMA Type 2 Diabetes Research Consortium (2014), analyzed approximately 9 million single nucleotide polymorphisms (SNP) of more than 8,000 Hispanic tests subjects, which were divided in two groups consisting of (1) diabetic and (2) non-diabetic (control). Among the sample, specific loci were identified in correlation with T2D (SIGMA, 2014). The loci identified was the solute carrier known as SLC16A11, which is a monocarboxylic acid transporter gene located in the 17th chromosome (SIGMA, 2014). The haplotype SLC16A11 carries four amino acid substitutes, its messenger RNA is located in the liver, and its protein is localized in the endoplasmic reticulum of cells (SIGMA, 2014). The SLC16A11 gene was analyzed, and its genome sequence was traced back to archaic DNA

  • f Neanderthals, suggesting that this genetic mutation is what increases the chances of Type 2 Diabetes

in the Hispanic population (SIGMA, 2014). In reference to its Pathophysiology the gene SLC16A11 alters lipid metabolisms and increases the amount of intracellular triacylglycerol levels in the body (SIGMA, 2014). In order to deliver to administer ADN, researchers constructed a cultured plasmid DNA encoded from a mouse by inserting the cDNA clone of ADN into a pVAX1 vector, naming it pVAX/ADN (Mei et al., 2010). According to the GenBank accession no. AF304466, RNA was extracted using Trizol and reverse transcriptase-polymerase chain reaction was performed in order to retrieve the full length of the mouse DNA (as cited by Mei et al., 2010). The cDNA clones were gel purified in 1% agar gels that contained 0.5 micrograms/mL ethidium bromide, and then inserted into T- vector, cut with EcoR 1, and re-inserted pVAX site resulting in the construction of pVAX/ADN strand (Mei et al., 2010). The Construction was then prepared using Endo Free Qiagen kit in order to remove all of the subsequent bacterial endotoxins (Mei et al., 2010). According to an article published by the Centers for Disease Control and Prevention (2017), the current expectancy of adults to acquire T2D in the U.S is approximately 50%. Moreover, the CDC (2017) states that Hispanics have a greater risk of developing diabetes compared to non-Hispanics. Additionally, Hispanics have a 50% greater chance of dying from diabetes than Caucasian males are (Centers for Disease Control and Prevention, 2017). As previously mentioned, family history of diabetes (FHD) causes diabetes, however occasionally it is not only because of genetic relation. (CDC, 2017) There is an environmental factor that affects certain habits that increase risks; these habits are taught and/or absorbed family members (CDC, 2017). The Pew Research Center displays a graph showing statistical data stating that 21.9% of Hispanics are living in poverty, and 61.4% of Hispanics have high school equivalent education or less (Flores, López, & Radford, 2017). The risk of T2D increases substantially in populations with low education and low socioeconomic position (SEP)(Dalsgaard, 2015). This can be caused by life style factors, accessibility to health care, and psychological burden, and stresses of poverty (Dalsgaard, 2015). Some well-known risk factors associated with Type 2 Diabetes and SEP are smoking, physical inactivity, and obesity (Dalsgaard, 2015). Agardh concluded that there is a 41% higher risk for T2D and people of low SEP in comparison to individuals with high SEP (as cited by Dalsgaard, 2015.) The California Department of Health Services (2005), claims that in contrast to other ethnic groups in the state, Latinos have the highest rates of obesity; approximately 7 out of every 10 Hispanic adults (Latino Coalition for A Healthy California, 2006). According to the Surgeon General’s Call to Action (2001), the cause of the obesity epidemic is excessive caloric intake in relation to unhealthy dietary habits along with inadequate physical activity (LCHC, 2006). Individual dietary habits and physical inactivity are shaped by external factors encountered in the physical environments of communities (LCHC, 2006). Typically the Latino/Hispanic populations live disproportionately among communities that embolden unhealthy dietary choices and dishearten individuals to not acquire adequate physical activity (LCHC, 2006). Such communities statistically have higher fast food outlets, convenient stores, small grocery outlets, and limited places where constituents can safely and/or consistently get sufficient exercise (LCHC, 2006). Along with understanding the biological and genetic factors of T2D, it is paramount to understand the coinciding health issues, culture, resources, and environmental structure of the Hispanic population (LCHC, 2006). As previously mentioned, one of the barriers Hispanics face nationally is inadequate physical

  • inactivity. Nationally Hispanics report low levels of physical activity (Bautista, et al., 2011).

Engagement in physical activity is widely recognized to have numerous health benefits and regular

slide-5
SLIDE 5

MOL2NET, 2017, 3, doi:10.3390/mol2net-03-xxxx 5 participation has been known to improve mental health and decrease risks of chronic health conditions, such as T2D and obesity (Bautista et al., 2011). According to the U.S Department of Human Health Services (2007), the minimum requirements for adults is at least 150 minutes of moderate-intensity physical activity per week or 75 minutes of high-intensity exercise per week (as stated by Bautista et al., 2011). Hispanics are the largest minority group inhabiting the United States, approximately 15% of the population, and yet the National Health Interview Survey (2008) found that Hispanic subgroups all had lower leisure and physical activity time in comparison to Caucasians (Bautista et al., 2011). The Hispanic demographics have a higher frequency of diabetes, which has brought on the notion of promoting physical regular physical activity (Bautista et al., 2011). Hispanics also face a dietary barrier and have societal constraints in finding food: many Hispanics inhabit low-income neighborhoods where health food outlets are scarce (LCHC, 2006). Typically Hispanics in low-income areas have limited choices and have predominantly more liquor stores and mini-markets at their disposable; which is stocked with high caloric options and have limited access to fresh produce and healthy alternatives (LCHC, 2006). The California Nutrition Network (2005) claims that 52% constituents of predominantly low-income areas are one-half mile away from a convenient store/mini market (as cited by LCHC, 2006). Additionally, fast food restaurants tend to cluster low-income areas and 64% of Hispanics say its too difficult get fresh fruits and vegetables at work (LCHC, 2006). Materials and Methods A partnership was acquired with local endocrinologists in order to randomize test subjects for the clinical trials conducted. Patients of these specialists were asked if they would like to participate in a clinical trial testing a new diabetic treatment awaiting human trials before FDA approval. The partnered physicians were blinded and not aware of the specifics of the clinical trial to ensure any formation of biases with possible subjects. The outlined eligibility criteria for the clinical trial are as follows: (1) Subject must be between the ages of 18 – 55, (2) have a diagnoses of T2D, (3) currently taking Metformin, (4) must be of Hispanic Origin, and (5) must be a resident of Miami-Dade County. This resulted in the acquisition 3,318 potential participants. Subjects were then given a secondary preliminary screening in which their diet and exercise regimens were analyzed. Only subjects meeting the criteria of 100 or more minutes of weekly exercise, and dietary habits consistent with that suggested by their perspective endocrinologists were chosen, which in turn narrowed the sample size to 2,103 subjects. The 2,103 tests subjects were scheduled throughout different testing sites over the span of 10 days to undergo preliminary blood examinations. Subjects were advised to fast for 8 hours prior to undergoing blood sample draw. The intention of the blood exam was to analyze subjects fasting glucose levels (A1C %), Adiponectin levels, and DNA examination of the SLC16A11 loci located in the 17th chromosome. Only 46% (n = 968) of the subjects tested positive for all 3 criteria and moved to the administration phase of diPGA. Of the 968, 492 were female and 476 were male. The new medication being tested is known as diPGA (Diabetes Please Go Away) and contains an artificially replicated version of the subjects SLC16A11 loci: which consists of the loci along with Adiponectin (ADN) and insulin like growth factor 1 (IGF-1) attached to genetically modified enzymatic receptor sites. In order to achieve this, SLC16A11 was isolated and genetically engineered into a vector (SLAC). Plasmid encoded ADN and IGF-1 were constructed by inserting their cloned DNA copies into the SLAC vector using the EcoR 1 restriction enzyme. The vector was then cultured in Dulbecco’s Modified Eagle’s Medium. The RNA was extracted using Trizol and reverse transcriptase was performed to retrieve the strand. The cloned ADN and IGF-1 was reinserted to the SLAC vector, cut with the EcoR 1 enzyme and reinserted into the Eco R 1 site of the SLAC vector, creating diPGA, the AND/IGF-1 genetically modified into SLC16A11 locus. The diPGA was then purified using the Endo Free Qiagen Kit to ensure the removal of any harmful bactericides or endotoxins. The test subjects were then administered diPGA intravenously as an infusion on a weight based dose at 0.5 μ/kg/min over 1 hour. The infusions were given twice a week to each subject on the same

slide-6
SLIDE 6

MOL2NET, 2017, 3, doi:10.3390/mol2net-03-xxxx 6 allotted days. Subjects were instructed to continue on their regular Metformin medication throughout the duration of the Clinical Trial. The Control Group was given a B12 vitamin shot in substitution for the treatment. Experimental Groups were also given the B12 vitamin shots along with diPGA in order to accurately differentiate results between the groups. Subjects were divided into 2 groups: (1) Control Group and (2) Experimental Group. The Sample consisted of 492 female and 476 male subjects (n = 968) and were advised that at any point in time they can remove themselves from the study. They were also advised to seek emergency medical care if any adverse reactions occurred. Possible side effects were and not limited to tachycardia, fever, nausea, vomiting, dizziness, and hypoglycemia. Throughout the clinical trial, 13% (117) of the remaining subjects extracted themselves from the study (n = 851; 433 females and 428 males), in which observational data of the subjects were excluded from the results. The final groups included in the results were: (1) Control group [n = 425; 217 females and 208 males], (2) Experimental Group [n = 426; 216 females and 210 males]. Results were organized and recorded using Microsoft Excel. The mean average of each dependent variable was used to create marked line graphs to demonstrate trends. Subjects fasting glucose (A1C%) and ADN levels were tested at 3-month intervals for the first year, and 6-month intervals the following two years. They were advised to fast and discontinue Metformin 8 hours prior to testing. In order to obtain the fasting glucose levels of the subjects, the industry standard A1C Hemoglobin test was used to avoid any skewed results. The A1C test shows average levels of blood sugar over a corresponding period of 3 months. Blood was drawn using standard blood drawing procedures and were collected in the Lavender, or Purple, top test vials which are interiorly coated with EDTA K2, and required at least 1 mL of blood for testing. A HemoPoint H2 Analyzer was used to result the samples. The A1C results will be reported as percentages. In order to test for ADN levels, the ADN Serum test was administered. The specimens were placed in in a Gel- barrier tube referred to as a SST, or Tiger Top, which requires 0.3 – 10.0 mL of

  • serum. Upon collection of sample, tubes were gently inverted 5 times and allowed to clot for 30
  • minutes. Samples were then centrifuged at 1300 rcf for 10 minutes. Serum samples were stored in 2°C

to 8°C and transported the same day to the laboratory testing facility. Turn around time for samples ranged from 7 to 10 days. Results In order to effectively display fasting glucose levels, A1C hemoglobin levels were used in its

  • place. Figure (1) displays a reference guide for A1C hemoglobin levels and there mean corresponding

glucose levels. Levels were color categorized to display severity levels: Red (severely elevated levels. Involves Risks of serious health complications such heart attack, stroke, blindness, end stage renal failure, and necrosis), Yellow (Elevated and Poorly controlled levels), and Green (Normal Levels). An A1C Diabetes test above 5.9% is considered Pre-Diabetic. To be diagnosed with Diabetes, the minimum A1C level is 6.5% or above. An individual already diagnosed with Diabetes, an A1C of 7.0% or below is considered an adequate level. Figure (1) Severity A1C Levels Glucose Levels Severly Elevated 13 380 12 345 11 310 10 275 Elevated 9 240 8 205 7 170 Normal Levels 6 135 5 100 4 65

slide-7
SLIDE 7

MOL2NET, 2017, 3, doi:10.3390/mol2net-03-xxxx 7 The ADN levels are displayed in Figure (2). The initial results are represented by the Value “0 Months” on the x-axis. The initial sample mean ADN levels of the Control Group (n = 425) was 10.63 μ /ml. The Control group demonstrated insignificant changes (less that 5% of mean) throughout the 36-month trial period. The Experimental Group (n = 426) had an initial sample mean of 10.65 μ/ml. The percentage increase [(new value – initial value) /new value] formula was used to acquire the percentage increase of each interval and is displayed next to its corresponding value. The values are followed; 3 months = 12.34 μ/ml (16%); 6 months = 15.66 μ/ml (47%), 9 months = 19.38 μ/ml (82%); 12 months = 24.82 μ/ml (133%); 18 months = 30.88 μ/ml (190%); 24 months = 35.44 μ/ml (233%); 30 months = 36.32 μ/ml (241%); 36 months = 36.66 (244%). Figure (2) The AIC hemoglobin (fasting glucose levels) are displayed in Figure (3). The initial sample mean of the Control Group (n = 425) was 8.67% at 0 months. The Control group demonstrated insignificant changes (less that 5% of initial result) throughout the 36-month trial period. The Experimental Group (n = 426) had an initial sample mean of 8.85% at 0 months. The values are as followed; 3 months = 8.55% (-3%); 6 months = 8.23% (-7%); 9 months = 7.87% (-11%); 12 months = 7.22% (-18%); 18 months = 6.6% (-25%); 24 months = 6.28% (-29%); 30 months = 6.21% (-30%); 36 months = 6.22% (-30%). Figure (3)

5 10 15 20 25 30 35 40 3 6 9 12 18 24 30 36 ADN levels (microgams/mL) Months

ADN Levels

Control Group (Placebo) Experimental Group

slide-8
SLIDE 8

MOL2NET, 2017, 3, doi:10.3390/mol2net-03-xxxx 8 Data was also categorized by gender (female and male) in order to determine any differentiation of results between the sexes. Figure (4) illustrates ADN levels of the Control Groups and Experimental Groups for both sexes. The Female Control Group (n = 217) displayed an initial mean 11.34 μ/ml and the Male Control Groups (n = 208) displayed an initial mean of 9.92 μ/ml. The two control groups did not show any significant levels of changes (less than 5% of initial result) throughout the trial. The initial mean of the Female Experimental Group (n = 216) was 11.35 μ/ml at 0

  • months. The results are as followed; 3 months = 14.67 μ/ml (29%); 6 months = 18.84 μ/ml (66%); 9

months = 21.22 μ/ml (87%); 12 months = 27.87 μ/ml (146%); 18 months = 35.88 μ/ml (216%); 24 months = 36.23 μ/ml (219%); 30 months = 36.44 μ/ml (222%); 36 months = 37.09 μ/ml (227%). The initial mean of the Male Experimental Group (n = 210) was 9.95 μ/ml. The results are as followed; 3 months = 10.01 μ/ml (1%); 6 months = 12.47 μ/ml (25%); 9 months = 17.53 μ/ml (76%); 12 months = 21.76 μ/ml (119%); 18 months = 25.88 μ/ml (160%); 24 months = 34.64 μ/ml (248%); 30 months = 36.08 μ/ml (263%); 36 months = 36.22μ/ml (264%). Figure (4)

5 5.5 6 6.5 7 7.5 8 8.5 9 9.5 3 6 9 12 18 24 30 36 A1C % Months

Fasting Glucose

Control Group (Placebo) Experimental Group

slide-9
SLIDE 9

MOL2NET, 2017, 3, doi:10.3390/mol2net-03-xxxx 9 Figure (5) illustrates Fasting glucose levels as A1C % of the Control Groups and Experimental Groups for both sexes. The Female Control Group (n = 217) displayed an initial mean of 8.43% and the Male Control Groups (n = 208) displayed an initial mean of 8.91%. The two control groups did not show any significant levels of changes (less than 5% of initial result) throughout the trial. The initial mean of the Female Experimental Group (n = 216) was 8.56% at 0 months. The results are as followed; 3 months = 8.22% (-4%); 6 months = 8.02% (-6%); 9 months = 7.76% (-9%); 12 months = 6.9% (-19%); 18 months = 6.2% (-0.28%); 24 months = 6.0% (-30%); 30 months = 6.10% (-29%); 36 months = 6.13% (-28%). The initial mean of the Male Experimental Group (n = 210) was 9.02%. The results are as followed; 3 months = 8.88% (-2%); 6 months = 8.43% (-7%); 9 months = 7.98% (-12%); 12 months = 7.53% (17%); 18 months = 6.9% (-24%); 24 months = 6.55% (-27%); 30 months = 6.32% (-30%); 36 months = 6.30% (-30%). Figure (5)

5 10 15 20 25 30 35 40 3 6 9 12 18 24 30 36 ADN Levels (micrograms/mL) Months

ADN Levels (Male & Female)

Female Control Group (Placebo) Female Experimental Group Male Control (Placebo) Male Experimental Group

slide-10
SLIDE 10

MOL2NET, 2017, 3, doi:10.3390/mol2net-03-xxxx 10 Conclusions The results throughout this clinical trial have suggested a substantial significance among groups receiving treatments. The Control Group, displayed by Figure (2), had no significant changes (less than 5%) throughout the trial by displaying a plateauing trend throughout the graph. However, the Experimental group illustrates a 244% mean ADN level increase (36.66 μ/ml) in comparison to the initial mean level of 10.65 μ/ml. The results display a correlation between diPGA administration and rising ADN levels, where ADN levels rise steadily and begin to plateau at the end of the trial. Additionally, in Figure (3), the Control Group had an initial mean A1C Hemoglobin level of 8.67% and the Experiential Group had an initial mean A1C Hemoglobin level of 8.85%, which according to Figure (1) translates to blood glucose levels between 205-240mg/dL. The Control Groups show an insignificant change throughout the clinical trial (less than 5%), and displays no trends. However, the Experimental Group showed a decrease of 30% from initial mean fasting glucose levels (A1C%) at the cessation of the trial, from 8.85% to 6.22%, which translates to an ending mean blood glucose level of 135-170 mg/dL (normal levels to borderline elevated as per Figure 1). The difference between ending and initial mean glucose levels is 70 mg/dL (29 -34% decrease). The data in Figure (4) demonstrates the ADN levels, of the subjects subcategorized by the subject’s sex. Among the Control Group, the initial mean ADN levels for females were 11.34 μ/ml and males were 9.92 μ/ml. Neither Control group displayed any trends with significant meaning (less than 5%) and remained horizontal throughout the trial. In reference to the Experimental Group, females displayed an initial mean ADN level of 11.35 μ/ml that increased 226% to 37.09 μ/ml, while male ADN levels were 9.95 μ/ml, which increased 264% to 36.22 μ/ml. The data suggests that females initially had higher ADN levels than males, however both sexes reacted to diPGA significantly. Males showed a higher increase in percentage (41%) than females. The data in Figure (5) demonstrates the A1C% levels of the subjects subcategorized by the subject’s sex. Among the sexes of the Control Group, the initial mean A1C% levels for females were 8.43% and males were 8.91%. Neither Control groups displayed any trends with significant meaning (less than 5%) and remained horizontal throughout the trial. In reference to the sexes of the Experimental Group, females displayed an initial mean A1C% level of 8.56 A1C%, which decreased 26% to 6.13 A1C% whereas male A1C% levels decreased 30% from 9.02 A1C% to 6.3 A1C% The data suggests that both sexes initially had relatively similar fasting glucose levels (A1C%), and both sexes reacted to diPGA significantly by falling between 6%-7% A1C Hemoglobin % level, which as

5 5.5 6 6.5 7 7.5 8 8.5 9 9.5 3 6 9 12 18 24 30 36 A1C % Months

Fasting Glucose Levels (Male and Female)

Female Control Group (Placebo) Female Experimental Group Male Control (Placebo) Male Experimental Group

slide-11
SLIDE 11

MOL2NET, 2017, 3, doi:10.3390/mol2net-03-xxxx 11 shown in Figure (1), indicates normal levels. Moreover, this suggests that the subjects are no longer considered to be Type 2 Diabetics due to the fact that A1C% criteria for diagnoses are no longer met. The data collected suggests a negative correlation between the experimental groups: as ADN levels increased over time and stabilized, fasting glucose levels adversely decreased and stabilized. The results can have an astounding impact on the scientific community due to the genetic methods of treatment for the disease. The construction and results of the diPGA trials will hopefully cause a shift in medicine from treating diagnoses to curing diagnoses, particularly on the genetic level. The Hispanics of Miami-Dade County should also reap the benefits of this medication, which provides the first signs of curing of genetically predisposed T2D among their demographics. Their participation provided a pivotal impact on the Hispanic community and continued research and development may provide an end to the pandemic disease affecting the Hispanic demographic worldwide. In order to test validity, accuracy, and relevance other geneticists should replicate the diPGA trials in order to compare. Moreover, a future study will be replicated in Hispanic demographics in

  • ther geographical areas for comparison of results. Further implications include testing the Fasting

Glucose levels of subjects who have already undergone the trial without taking their Metformin

  • medication. Also, a post trial should be conducted where ADN and A1C% levels are checked

periodically to observe if any changes occur to the subjects once the cessation of diPGA has occurred. Furthermore, genetic therapy clinical trials for different demographics with T2D should be conducted by constructing diPGA based on a specific’s demographic gene. The suggestions above could possibly strengthen the findings of this clinical trial and fill any gaps the FDA may have prior to allowing implementation of diPGA treatments nationwide. The trial conducted was designed in accordance with standard ethical guidelines. The FDA was consulted and asked to perform an independent review prior to commencing the trials in order to ensure practices met certain ethical guidelines and found the risk-benefit ratio were acceptable. The research displayed scientific validity because an attainable and answerable question/ goal was used

  • throughout. Subject selection was unbiased and fair, except for qualifying criteria. Subjects were not

chosen based on vulnerability, socioeconomic position, or other unrelated prejudices to the study. All subjects provided informed consent and were aware of the possible side effects of diPGA, and advised to seek emergency medical attention if specific reaction occurred throughout the trial. DiPGA’s benefactors provided an emergency medical fund to compensate any medical issues caused by the trial. Additionally, the privacy of all subjects was maintained throughout the trial and HIPAA Laws were not violated throughout the duration of the trial. Subjects were given the results to demonstrate the significance the study provided. Possible social issues that can present after diPGA approval are poverty, education, lack of access to affordable health care, and language barriers. As previously stated, an large portion of the Hispanic demographic in the United States live in poverty, and may not be able to afford the medication even if it were available on the market. Even if healthcare is available, insurance companies may not cover the medication due to contractual agreements or profits with current market medications. Therefore, legislation should be set forth by politicians to allot funding and subsidies for diPGA so that the Hispanic demographic can be able to receive treatment if they do not have the means to do so

  • themselves. Implementation of this legislation should promote diPGA to the pharmaceutical and

healthcare markets and incentivize the usage to both parties. Awareness can be made by partnerships with physicians groups, government agencies, public health agencies, hospitals, and other community advocates promoting the implications of the

  • medication. The most important aspect of awareness would be educating the public on the existence of

the SLC16A11 loci (diabetic gene), and demonstrate that there can possibility a cure for the genetic deficiency. References American Diabetes Association (2017). Statistics about diabetes. Retrieved from http://www.diabetes.org/diabetesbasics/statistics Andersson, E., Allin, K., Sandholt, C., Borglykke, A., Lau, C., Ribel-Madsen, R., & ... Pedersen, O. (2013). Genetic risk score of 46 type 2 diabetes risk variants associates with changes in plasma

slide-12
SLIDE 12

MOL2NET, 2017, 3, doi:10.3390/mol2net-03-xxxx 12 glucose and estimates of pancreatic ß-cell function over 5 years of follow-up. Diabetes, 62(10), 3610-3617. Bautista, L., Reininger, B., Gay, J. L., Barroso, C. S., & McCormick, J. B. (2011). Perceived Barriers to Exercise in Hispanic Adults by Level of Activity. Journal of Physical Activity & Health, 8(7), 916–925. Centers for Disease Control and Prevention (2017). Hispanic health: preventing type 2 diabetes. Retrieved from https://www.cdc.gov/features/hispanichealth/index.html Copstead, L.E. & Banasik, J. (2013). Pathophysiology, ed 5 (824-826). St. Louis, MO: Saunders, an imprint of Elsevier Inc. Dalsgaard, E. M. (2015). Socio-economic position and risk of T2DM. Diapedia. doi: 3104466190.10 Diabetes Teaching Center at the University of California, San Francisco (n.d). Types of diabetes. Retrieved from https://dtc.ucsf.edu/types-of-diabetes/ Doucleff, M. (2013). Your health: diabetes gene common in latinos has ancient health. Shots: health news from NPR. Retrieved from: https://www.npr.org/sections/health- shots/2013/12/25/256832685/diabetes-gene-common-in-latinos-has-ancient-roots Flores, A., López, G., & Radford, R. (2017). Facts on u.s latinos, 2015: statistical portrait of hispanics in the u.s. Pew Research Center Hispanic Trends. Retrieved from http://www.pewhispanic.org/2017/09/18/facts-on-u-s-latinos-trend-data/ Kogan, A. E., Filatov, V. L., Kolosova, O. V., Katrukha, I. A., Mironova, E. V., Zhuravleva,

  • N. S.,

& Katrukha, A. G. (2013). Oligomeric adiponectin forms and their complexes in the blood of healthy donors and patients with type 2 diabetes mellitus. Journal Of Immunoassay & Immunochemistry, 34(2), 180-196. doi:10.1080/15321819.2012.699494 Latino Coalition for a Healthy Califronia (2006). Obesity in latino communities: prevention, plan, and action. Retrieved from http://www.lchc.org/wp- content/uploads/2005_Obesity_in_Latino_Communities_NewLogo.pdf Mayo Clinic (2017). Type 2 diabetes: diagnoses and treatment. Retrieved from https://www.mayoclinic.org/diseases-conditions/type-2-diabetes/diagnosis-treatment/drc- 20351199 Mei Hua, N., Jeong-Sook, P., & Chang-Seon, M. (2010). Construction of adiponectin-encoding plasmid DNA and gene therapy of non-obese type 2 diabetes mellitus. Journal Of Drug Targeting, 18(1), 67-77. doi:10.3109/10611860903225719 Orrù, S., Nigro, E., Mandola, A., Alfieri, A., Buono, P., Daniele, A., & ... Imperlini, E. (2017). A Functional Interplay between IGF-1 and Adiponectin. International Journal Of Molecular Sciences, 18(10), 1-15. doi:10.3390/ijms18102145 SIGMA Type 2 Diabetes Consortium (2014). Sequence variants in SLC16A11 are a common risk factor for type 2 diabetes in Mexico Final Draft. Nature, 506(7486), 97- 101. doi:10.1038/nature12828 Stuart, K. (2017). Diabetes drug metformin may work by altering gut microbiome. Australasian College Of Nutritional & Environmental Medicine Journal, 36(2), 20-21. Zhao, Y., Song, C., Ma, X., Ma, X., Wang, Q., Ji, H., & ... Qin, G. (2017). Synergistic Effect of Family History of Diabetes and Dietary Habits on the Risk of Type 2 Diabetes in Central

  • China. International Journal Of Endocrinology, 1-8. doi:10.1155/2017/9707284