
SLIDE 1
1
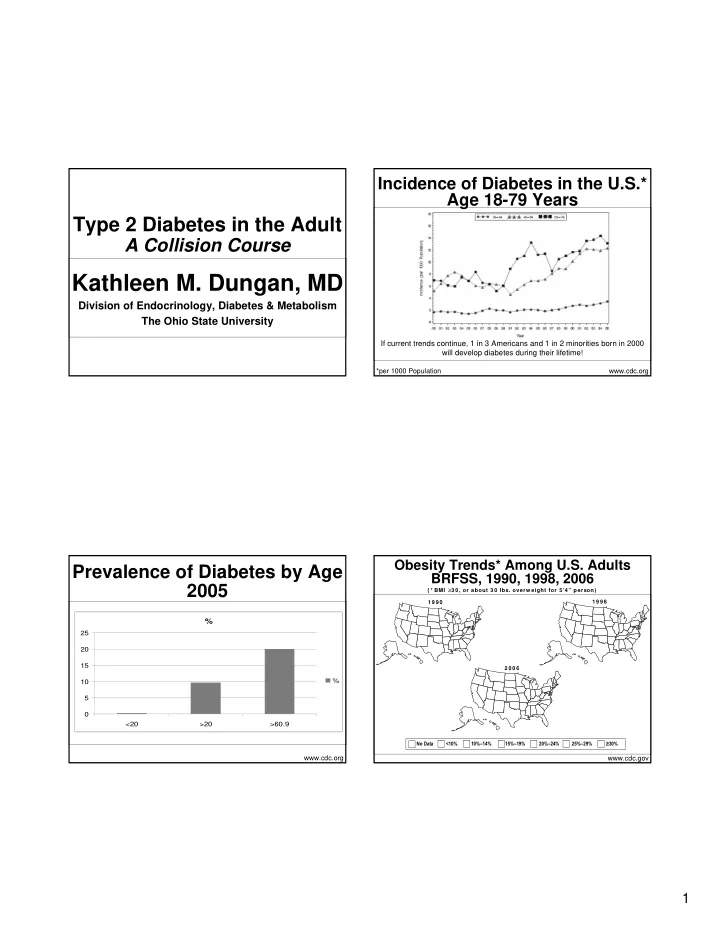
Type 2 Diabetes in the Adult
A Collision Course
Kathleen M. Dungan, MD
Division of Endocrinology, Diabetes & Metabolism The Ohio State University
Prevalence of Diabetes by Age 2005
%
5 10 15 20 25 <20 >20 >60.9 % www.cdc.org
Incidence of Diabetes in the U.S.* Age 18-79 Years
www.cdc.org *per 1000 Population
If current trends continue, 1 in 3 Americans and 1 in 2 minorities born in 2000 will develop diabetes during their lifetime!
Obesity Trends* Among U.S. Adults BRFSS, 1990, 1998, 2006
( * BMI ≥3 0, or about 30 lbs. overw eight for 5’4” person) No Data <10% 10%–14% 15%–19% 20%–24% 25%–29% ≥30% 1 9 9 8 2 0 0 6 1 9 9 0
www.cdc.gov