
MOL2NET, 2017, 3, doi:10.3390/mol2net-03-xxxx 1
MDPI
MOL2NET, International Conference Series on Multidisciplinary Sciences http://sciforum.net/conference/mol2net-03
Time series analysis of the EEG signals for Epilepsy seizure forecast
Mang S. Cing (E-mail: mcing@stu.edu ), David Quesada* (E-mail: dquesada@stu.edu ) School of Science, Technology, and Engineering Management, St. Thomas University, Miami Gardens, FL 33054, USA
* Corresponding author: David Quesada* (E-mail: dquesada@stu.edu )
Graphical Abstract Abstract.
Epilepsy is a Central Nervous Disorder that is affecting millions of people with a different degree of severity. This project is aimed at studying the feasibility to use the software R for statistical analysis of EEG signals in
- rder to perform statistical forecast of epileptic seizures
by constructing functional networks based on the cross- correlation of time series from different electrodes. Such functional associations are a result of an emergent neuronal activity of a large amount of neurons, thus, they will be guidance to physicians. A further understanding of the causes will require a combination
- f biomedical modeling and sensing with fMRI and
EEG combined.
- 1. Introduction
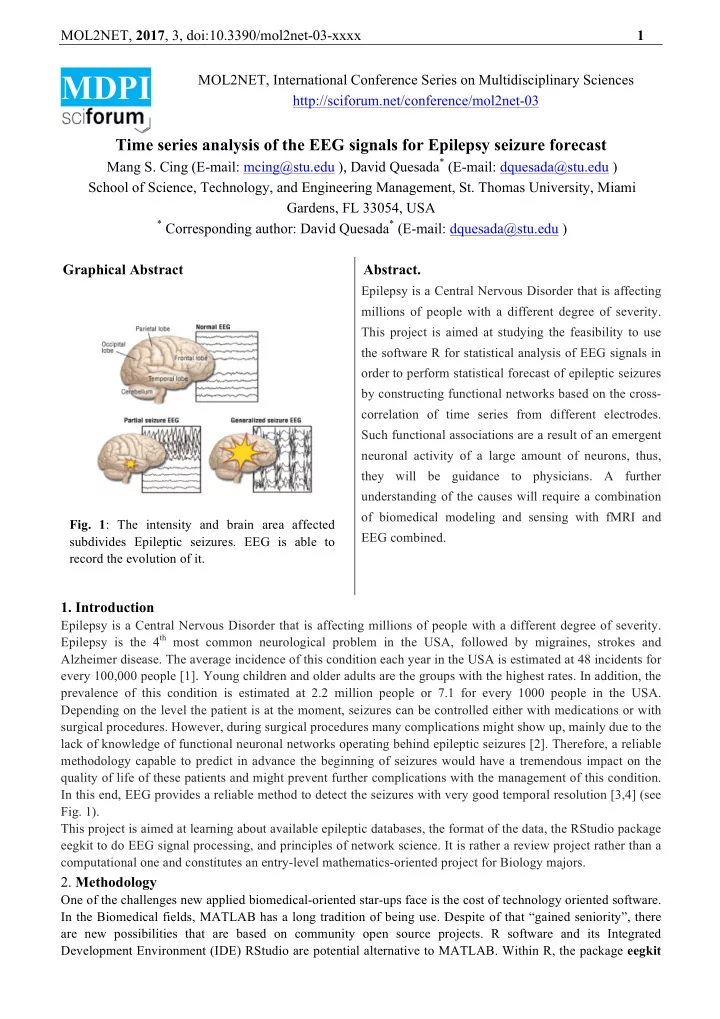
Epilepsy is a Central Nervous Disorder that is affecting millions of people with a different degree of severity. Epilepsy is the 4th most common neurological problem in the USA, followed by migraines, strokes and Alzheimer disease. The average incidence of this condition each year in the USA is estimated at 48 incidents for every 100,000 people [1]. Young children and older adults are the groups with the highest rates. In addition, the prevalence of this condition is estimated at 2.2 million people or 7.1 for every 1000 people in the USA. Depending on the level the patient is at the moment, seizures can be controlled either with medications or with surgical procedures. However, during surgical procedures many complications might show up, mainly due to the lack of knowledge of functional neuronal networks operating behind epileptic seizures [2]. Therefore, a reliable methodology capable to predict in advance the beginning of seizures would have a tremendous impact on the quality of life of these patients and might prevent further complications with the management of this condition. In this end, EEG provides a reliable method to detect the seizures with very good temporal resolution [3,4] (see
- Fig. 1).
This project is aimed at learning about available epileptic databases, the format of the data, the RStudio package eegkit to do EEG signal processing, and principles of network science. It is rather a review project rather than a computational one and constitutes an entry-level mathematics-oriented project for Biology majors.
- 2. Methodology
One of the challenges new applied biomedical-oriented star-ups face is the cost of technology oriented software. In the Biomedical fields, MATLAB has a long tradition of being use. Despite of that “gained seniority”, there are new possibilities that are based on community open source projects. R software and its Integrated Development Environment (IDE) RStudio are potential alternative to MATLAB. Within R, the package eegkit
- Fig. 1: The intensity and brain area affected
subdivides Epileptic seizures. EEG is able to record the evolution of it.