MOL2NET, 2017 , 3, doi:10.3390/mol2net-03-xxxx 2 Fig. 2 : Frequency - - PDF document

mol2net 2017 3 doi 10 3390 mol2net 03 xxxx 2
SMART_READER_LITE
LIVE PREVIEW

MOL2NET, 2017 , 3, doi:10.3390/mol2net-03-xxxx 2 Fig. 2 : Frequency - - PDF document

MOL2NET, 2017 , 3, doi:10.3390/mol2net-03-xxxx 1 MDPI MOL2NET, International Conference Series on Multidisciplinary Sciences http://sciforum.net/conference/mol2net-03 Time series analysis and forecast of respiratory conditions in Florida Paula De


slide-1
SLIDE 1

MOL2NET, 2017, 3, doi:10.3390/mol2net-03-xxxx 1

MDPI

MOL2NET, International Conference Series on Multidisciplinary Sciences http://sciforum.net/conference/mol2net-03

Time series analysis and forecast of respiratory conditions in Florida

Paula De la Plazaa (E-mail: paula.abreu002@mymdc.net ), David Quesada*,b (E-mail: dquesada@stu.edu )

a Miami Dade College, North Campus, Miami, FL 33168, USA b School of Science, Technology, and Engineering Management, St. Thomas University, Miami

Gardens, FL 33054, USA * Corresponding author: David Quesada (E-mail: dquesada@stu.edu ) Graphical Abstract Abstract.

In an effort to understand conditions triggering asthma episodes and therefore create a asthma risk index that might be valuable to both patients and medical practitioners, 6 different counties in Florida were chosen, 3 of them in the southeast region and 3 located in the central region. The number of cases at emergency rooms due to asthma and other respiratory conditions were provided by the Department of Health BRACE project and analyzed statistically looking for potential associations with weather and environmental conditions.

  • 1. Introduction

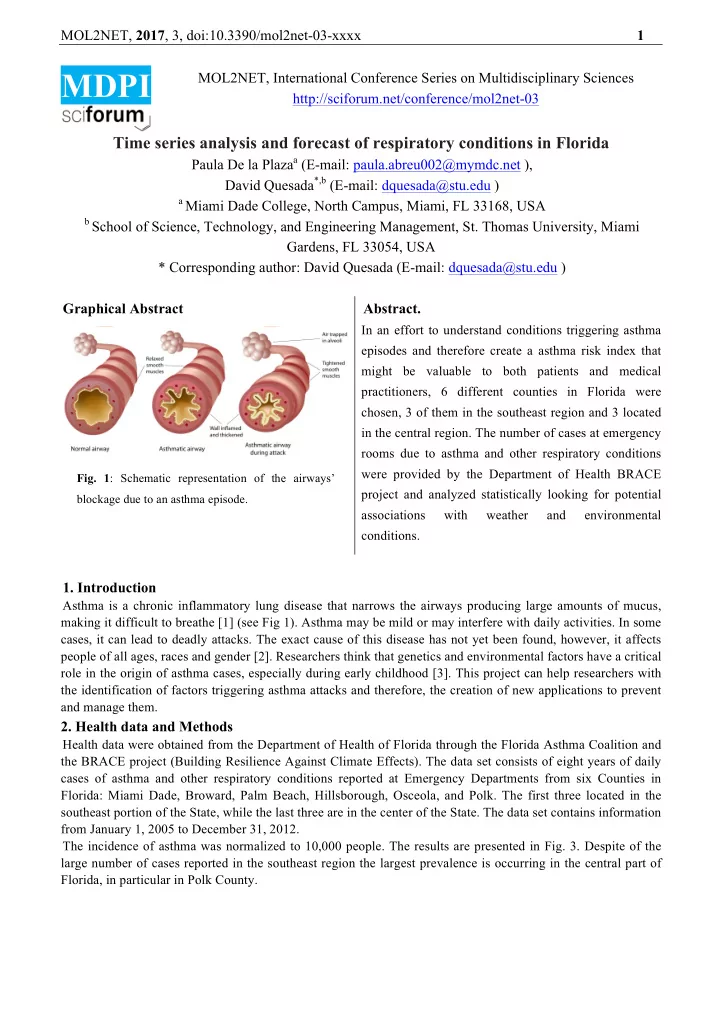
Asthma is a chronic inflammatory lung disease that narrows the airways producing large amounts of mucus, making it difficult to breathe [1] (see Fig 1). Asthma may be mild or may interfere with daily activities. In some cases, it can lead to deadly attacks. The exact cause of this disease has not yet been found, however, it affects people of all ages, races and gender [2]. Researchers think that genetics and environmental factors have a critical role in the origin of asthma cases, especially during early childhood [3]. This project can help researchers with the identification of factors triggering asthma attacks and therefore, the creation of new applications to prevent and manage them.

  • 2. Health data and Methods

Health data were obtained from the Department of Health of Florida through the Florida Asthma Coalition and the BRACE project (Building Resilience Against Climate Effects). The data set consists of eight years of daily cases of asthma and other respiratory conditions reported at Emergency Departments from six Counties in Florida: Miami Dade, Broward, Palm Beach, Hillsborough, Osceola, and Polk. The first three located in the southeast portion of the State, while the last three are in the center of the State. The data set contains information from January 1, 2005 to December 31, 2012. The incidence of asthma was normalized to 10,000 people. The results are presented in Fig. 3. Despite of the large number of cases reported in the southeast region the largest prevalence is occurring in the central part of Florida, in particular in Polk County.

  • Fig. 1: Schematic representation of the airways’

blockage due to an asthma episode.

slide-2
SLIDE 2

MOL2NET, 2017, 3, doi:10.3390/mol2net-03-xxxx 2

  • 3. Results and Discussion

The time series of asthma cases was analyzed with software RStudio for statistical computing. The results are shown in Fig. 4, and it is clear there is a seasonal component that peaks between December and February every year and drops between April and June. It seems to be associated with the thermal stress upper respiratory track undergoes during the “Florida winter” [4], causing a larger likelihood of being infected by upper respiratory track infections, which induce inflammatory processes in many people [5,6]. The overall trend of the series shows a gradual and steadily increases in the number of asthma cases since 2005. Such behavior might be associated with the gradual shift of temperatures and relative humidity towards higher values causing an increase of natural allergens. Health data were contrasted with meteorological and environmental data. The correlation between the number of asthma cases and the minimum temperature for the day is shown in Fig. 5.

  • 4. Conclusions

Asthma in Florida follows a seasonal pattern with peaks in late fall and winter that coincide also with the peaks

  • f upper respiratory tract infections at Emergency departments. The week association with minimum

temperature is an indication of nonlinear threshold response, due in much to the cold stress load facilitating the entrance of infection and the further triggering of inflammatory episodes.

Acknowledgments

Authors appreciate the support received from both, St. Thomas University and Miami Dade College, as wells as from the Department of Education grant P03C1160161 (STEM-SPACE).

  • Fig. 2: Frequency distribution of the number of asthma (left panel) and other respiratory conditions (right

panel) from six Counties in the State of Florida from January 1, 2005 to December 31, 2012.

  • Fig. 3: Prevalence of asthma through the State of Florida.
slide-3
SLIDE 3

MOL2NET, 2017, 3, doi:10.3390/mol2net-03-xxxx 3 References

  • 1. Panettieri RA, Covar R, Grant E, Hillyer EV. Natural history of asthma: Persistence versus progression, does

the beginning predict the end? J. Allergy Clin. Immunol. 121, 607 - 613 (2008).

  • 2. Jackson DJ, Sykes A, Mallia P, and Johnston SL, Asthma exacerbations: Origin, effect, and prevention, J.

Allergy Clin Immunol 128, 1165 - 1174 (2011).

  • 3. Lemanske RF and Busse WW, Asthma: Clinical expression and molecular mechanisms, J. Allergy Clin.

Immunol 125, S95 - 102 (2010).

  • 4. De Freitas CR, Grigorieva EA, Acclimatization Thermal Stress Index. Int. J. Biometeorol 53, 307 – 315

(2009).

  • 5. Eccles R, An Explanation for the Seasonality of Acute Upper Respiratory Tract Viral Infections. Acta

Otolaryngol, 183-191 (2002).

  • 6. Quesada D, Alejo A, The seasonality of upper respiratory tract infections and their relationship to asthma. In

Proceedings of the MOL2NET, International Conference on Multidisciplinary Sciences, Sciforum Electronic Conference Series, Vol. 2, 07003; doi:10.3390/mol2net-02-07003, (2016).

  • Fig. 4: Trend analysis of the time series of asthma cases. It was performed with software RStudio. Notice

components, the seasonal and the overall trend towards higher values.

  • Fig. 5: Correlation analysis between the numbers of cases and minimum temperature using a linear and

exponential model. In both cases, as the temperature increases, the number of cases decreases.