Modelling of the droplet entrainment phenomena for the simulation of - - PDF document

modelling of the droplet entrainment phenomena for the
SMART_READER_LITE
LIVE PREVIEW

Modelling of the droplet entrainment phenomena for the simulation of - - PDF document

Transactions of the Korean Nuclear Society Virtual Spring Meeting July 9-10, 2020 Modelling of the droplet entrainment phenomena for the simulation of reflood phase during a large-break loss-of-coolant accident in a pressurized water reactor Jee


slide-1
SLIDE 1

Modelling of the droplet entrainment phenomena for the simulation of reflood phase during a large-break loss-of-coolant accident in a pressurized water reactor

Jee Min Yoo, Byong Jo Yun, Jae Jun Jeong* School of Mechanical Engineering, Pusan National University (PNU) *Corresponding author: jjjeong@pusan.ac.kr

  • 1. Introduction

The droplet has a large surface area per unit volume and so it has excellent heat transfer characteristics. In a large-break loss-of-coolant (LOCA) in a pressurized water reactor (PWR), droplet behavior in the reactor core is very important. In particular, the droplets downstream of the quench front (QF) during the reflood phase greatly affect the thermal-hydraulic phenomena inside the reactor core. The droplets reduce the temperature of the superheated vapor through interfacial heat transfer and evaporate near the fuel to increase wall heat transfer. That is, the droplet behavior downstream

  • f the QF is closely related to the prediction of fuel
  • temperature. The droplets entrained into the U-tubes

induce the so-called steam binding effect, which also affects the core heat removal. Downstream of the QF, a post-dryout regime (inverted flow) is formed. To observe the thermal- hydraulic behavior under this flow condition, visualization experiments have been conducted[1-5]. Through the experiments, various droplet entrainment mechanisms in the post-dryout regime were identified. However, a few studies have been conducted to develop the droplet entrainment model using the experimental

  • bservation results. And there are still insufficient

experimental and theoretical researches related to the droplet entrainment phenomena downstream of the QF. In this paper, a droplet entrainment model was proposed based on the results of the experiments

  • bserving the droplet entrainment phenomena in post-

dryout regime. The proposed model and the existing models[6-9] were implemented into the CUPID code [10], in which the 3-field model is applied. And they were evaluated using reflood heat transfer experiments, such as FLECHT SEASET [11] and FEBA [12].

  • 2. Existing droplet entrainment models

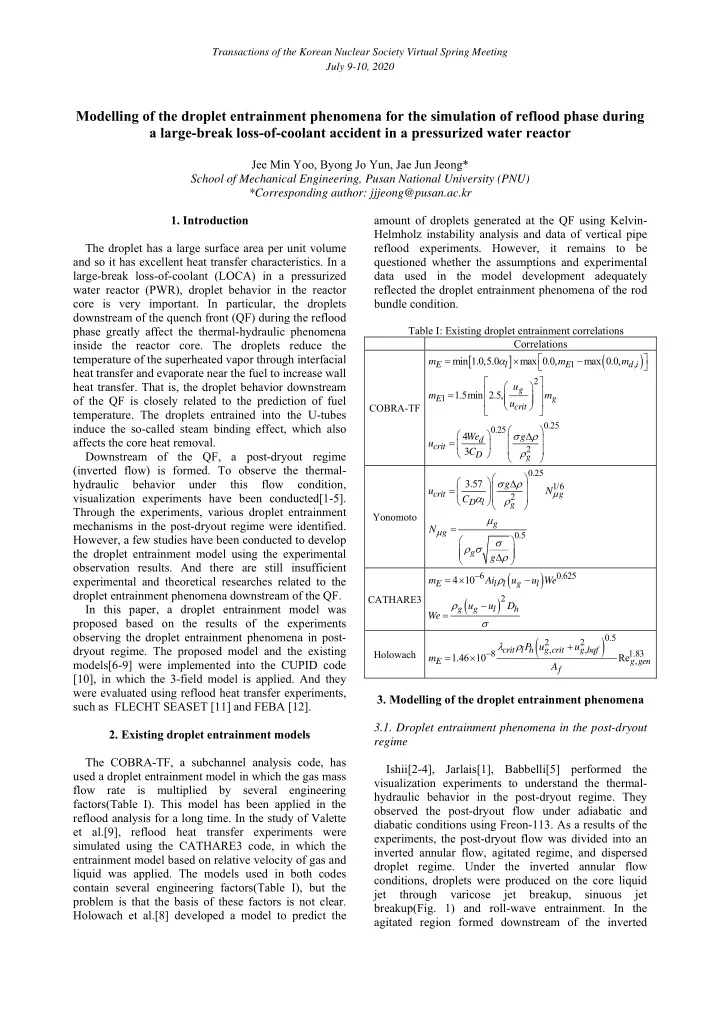
The COBRA-TF, a subchannel analysis code, has used a droplet entrainment model in which the gas mass flow rate is multiplied by several engineering factors(Table I). This model has been applied in the reflood analysis for a long time. In the study of Valette et al.[9], reflood heat transfer experiments were simulated using the CATHARE3 code, in which the entrainment model based on relative velocity of gas and liquid was applied. The models used in both codes contain several engineering factors(Table I), but the problem is that the basis of these factors is not clear. Holowach et al.[8] developed a model to predict the amount of droplets generated at the QF using Kelvin- Helmholz instability analysis and data of vertical pipe reflood experiments. However, it remains to be questioned whether the assumptions and experimental data used in the model development adequately reflected the droplet entrainment phenomena of the rod bundle condition.

Table I: Existing droplet entrainment correlations Correlations COBRA-TF

 

 

1 ,

min 1.0,5.0 max 0.0, max 0.0,

E l E d i

m m m        

2 1

1.5min 2.5,

g E g crit

u m m u                 

0.25 0.25 2

4 3

d crit D g

We g u C                    Yonomoto

0.25 1/6 2

3.57

crit g D l g

g u N C

                 

0.5 g g g

N g

               CATHARE3

 

6 0.625

4 10

E l l g l

m Ai u u We 

  

 

2 g g l h

u u D We     Holowach

 

0.5 2 2 , , 8 1.83 ,

1.46 10 Re

crit l h g crit g bqf E g gen f

P u u m A  

  

  • 3. Modelling of the droplet entrainment phenomena

3.1. Droplet entrainment phenomena in the post-dryout regime Ishii[2-4], Jarlais[1], Babbelli[5] performed the visualization experiments to understand the thermal- hydraulic behavior in the post-dryout regime. They

  • bserved the post-dryout flow under adiabatic and

diabatic conditions using Freon-113. As a results of the experiments, the post-dryout flow was divided into an inverted annular flow, agitated regime, and dispersed droplet regime. Under the inverted annular flow conditions, droplets were produced on the core liquid jet through varicose jet breakup, sinuous jet breakup(Fig. 1) and roll-wave entrainment. In the agitated region formed downstream of the inverted

Transactions of the Korean Nuclear Society Virtual Spring Meeting July 9-10, 2020

slide-2
SLIDE 2

annular flow, droplets were generated from the core liquid jet and the liquid sheet located near the heating surface (Fig. 1). The dispersed droplet regime consisted

  • f multiple droplets and a small amount of liquid
  • ligament. Through these, it can be seen that droplets are

mainly entrained from the core liquid jet and liquid sheet in the post-dryout regime.

(a) Varicose jet (b) Sinuous jet (c) Liquid sheet breakup

  • Fig. 1. Schematics of liquid jet and sheet

3.2. Modelling In this study, based on the observation results of the visualization experiments, the droplet entrainment rate

  • f the core liquid jet and the liquid sheet was modeled

using some correlations[2] and instability analysis[13]. The entrainment rate is defined as follows.

entr l E f w

V m A   

. (1) where

l

 and

f

A

are liquid density and flow area,

  • respectively. To obtain

E

m

, the volume of entrained droplets, entr

V

, and the breakup time w

were modeled. In the case of the core liquid jet breakup in the inverted annular flow, it is assumed that the droplets detached by the wavelength of the wave,  , based on the experiment of Ishii and Jarlais[2]. And, assuming that there is a core liquid jet per subchannel, entr

V

is defined as follows.

2

4

entr jet jet

V N D   

. (2) In the above equation,

jet

N

and

jet

D

are the number of jets and the jet diameter, respectively. w

is defined as the breakup length

B

L divided by the velocity of the

liquid jet.

B w l

L u  

. (3)

 and

B

L

in Eqs. 2 and 3 are calculated using the correlations proposed by Ishii and Jarlais[2]. Table II shows the correlations for the varicose jet and the sinuous jet. The experimental result that the liquid sheet is generated from the crest of the roll wave[2] and the result of instability analysis for the liquid sheet of Senecal[13] were introduced to derive the droplet entrainment on the liquid sheet. It is assumed that the liquid sheet is uniformly located near the heating

  • surface. The correlations for the liquid sheet breakup

are summarized in Table III. The droplet entrainment model was applied as shown in Table IV based on the post-dryout regime map of TRACE code[14]. The study of Ishii and Denten [4] showed that the agitated region existed up to about 0.85 void fraction. Based on this, conditions of void fraction from 0.6, which is the transition criteria for the inverted slug, to 0.85 are considered as the agitated regime. When the void fraction is 0.85 or more, it is considered as a dispersed droplet flow. In this flow condition, the assumption that all the continuous liquid phases become droplets was applied, and so the droplet entrainment rate was defined as

E l l l

m u   

.

Table II: Correlations for varicose and sinuous jet Correlations for varicose jet 5.8

jet

D   4 sub l

jet

A D    ,

f jet sub

A N A 

0.53 0.5

480Re

B j j jet

L We D

 Correlations for sinuous jet

2 ,

7.6

g jet g rel

D We    4 sub l

jet

A D    ,

f jet sub

A N A 

0.645 2 0.53 0.5 ,

685Re

g B j j jet g rel

L We D We 

         Table III: Correlations for the liquid sheet 2 2

s rw entr h

V P   

2

3

s g r

u     [13],

2 ,

7.6

g rw jet g rel

D We   

,max

1 ln

w r

a w a         [13]

3 6 ,max 2

4 27

g r r l

u w     , ln 12 a a        Transactions of the Korean Nuclear Society Virtual Spring Meeting July 9-10, 2020

slide-3
SLIDE 3

July 9-10, 2020 Table IV: Application of the droplet entrainment model for flow regime 1.0 0.9 0.6 0.0 Flow regime Entrainment model g  0.85 Dispersed droplet

E l l l

m u    Inverted slug (Transition) Core liquid jet & Liquid sheet Inverted annular Core liquid jet & Liquid sheet

  • r

Sinuous jet

  • r

Varicose jet

  • 4. Model assessment

4.1. Reflood tests selected for model assessment The FLECHT SEASET and FEBA, which are representative reflood heat transfer experiments, were used to evaluate the existing models and the new model. The experimental data used for model assessment are summarized in Tables V and VI. For the CUPID calculation, test sections of both experiments were simulated in one dimension.

Table V: The selected FEBA test conditions Test No. Pressure (bar) Inlet velocity (m/s) Inlet temp. (℃) 0-30s End 210 4.2 0.028 48 39 221 6.1 0.028 51 37 223 2.2 0.038 44 36 220 6.2 0.038 49 37 218 2.1 0.058 42 37 214 4.1 0.058 45 37 222 6.2 0.058 43 36

4.2. Assessment results The existing droplet entrainment models and the new model were implemented into the CUPID code and the models were assessed using the FEBA and FLECHT SEASET reflood tests. When evaluating the models, the peak clad temperature (PCT) of each test condition and the quenching time (QT) at the location where the PCT

  • ccurred were compared with the calculation results.

When comparing PCT, the highest temperature measured in the experiment was compared to the calculated temperature at the same position. QT was defined as the time at which the greatest change in clad temperature per unit time. Tables VII ~ X summarize the PCT error and QT error for each model. To compare the prediction performance of each model, the mean absolute error(MAE) is shown in the bottom row of each table. For the FEBA experiment, the new model shows the smallest error in both PCT and QT(Tables VII and VIII). For the FLECHT SEASET experiment, the new model yields the smallest PCT error(Table XI). In the case of QT, the new model shows a slightly larger error than the other models(Table X). However, from the overall perspective, it can be said that the new model best predicts PCT and QT.

Table VI: The selected FLECHT SEASET test conditions Test No. Pressure (bar) Inlet velocity (m/s) Coolant

  • temp. (℃)

30817 2.7 0.039 53 31021 2.8 0.039 52 31108 1.3 0.079 33 31203 2.8 0.038 52 31302 2.8 0.077 52 31504 2.8 0.024 51 31701 2.8 0.155 53 31805 2.8 0.021 51 31922 1.4 0.027 35 32013 4.1 0.026 66 34006 2.7 0.015 51 34209 1.4 0.027 32 34524 2.8 0.040 52 34610 1.4 0.021 32 Table VII: PCT error for the FEBA tests Test No. PCT error (K)

New model COBRA-TF Yonomoto Holowach CATHARE

210 8.30 23.50

  • 25.10
  • 30.40
  • 28.70

214

  • 23.33
  • 19.53
  • 15.33
  • 15.33
  • 11.93

218

  • 13.32
  • 19.02
  • 29.62
  • 23.92
  • 20.62

220

  • 38.93
  • 41.43
  • 34.03
  • 35.73
  • 36.73

221

  • 15.92
  • 23.62
  • 9.32
  • 12.62
  • 12.62

222

  • 11.71
  • 1.81

4.09 5.49 4.99 223 0.94

  • 8.56
  • 15.06
  • 16.16
  • 8.76

MAE 16.06 19.64 18.94 19.95 17.76 Table VIII: QT error for the FEBA tests Test No. QT error (s)

New model COBRA-TF Yonomoto Holowach CATHARE

210 29.08 44.58

  • 22.92
  • 31.42
  • 47.92

214 10.75

  • 8.75
  • 25.75
  • 30.75
  • 41.75

218 8.40

  • 51.60
  • 65.60
  • 60.10
  • 65.10

220 4.20

  • 6.30
  • 24.30
  • 37.30
  • 42.80

221 35.90 38.40 24.90

  • 4.60
  • 20.60

222 17.10

  • 5.90
  • 28.40
  • 30.90
  • 38.40

223 14.15

  • 19.35
  • 73.85
  • 58.85
  • 76.35

MAE 17.08 24.98 37.96 36.27 47.56 Transactions of the Korean Nuclear Society Virtual Spring Meeting

slide-4
SLIDE 4

Table XI: PCT error for the FLECHT SEASET tests Test No. PCT error (K)

New model COBRA-TF Yonomoto Holowach CATHARE

30817 11.87

  • 0.63
  • 20.63

11.87

  • 11.53

31021

  • 36.03
  • 35.33
  • 35.33
  • 36.03
  • 31.43

31108

  • 4.01
  • 25.01
  • 19.41
  • 4.01
  • 13.91

31203 1.62 4.72 1.52 5.22 13.32 31302

  • 17.05
  • 22.35
  • 16.25
  • 17.05
  • 10.25

31504 43.57 32.77 19.17 39.07 52.37 31701

  • 58.74
  • 55.54
  • 55.84
  • 58.64
  • 54.24

31805

  • 5.05
  • 2.85
  • 20.25
  • 16.65

10.95 31922

  • 10.78
  • 12.38
  • 7.78
  • 16.78
  • 2.48

32013

  • 17.62
  • 17.02
  • 21.42
  • 25.52
  • 9.52

34006

  • 85.72
  • 85.02
  • 97.02
  • 82.42
  • 80.82

34209 13.03 19.73 0.33 13.03 38.03 34524

  • 27.02
  • 37.42
  • 59.62
  • 27.02
  • 43.82

34610

  • 2.76
  • 1.26
  • 15.16
  • 12.86

2.94 MAE 23.92 25.14 27.84 26.15 26.83 Table X: QT error for the FLECHT SEASET tests Test No. QT error (s)

New model COBRA-TF Yonomoto Holowach CATHARE

30817

  • 29.71
  • 36.21
  • 42.21
  • 29.71
  • 38.71

31021

  • 10.45
  • 7.45
  • 9.45
  • 10.45
  • 12.45

31108 45.95 26.45 26.95 45.95 24.95 31203

  • 11.92
  • 9.92
  • 17.92
  • 12.42
  • 17.92

31302 10.85 1.85 2.35 10.85 5.35 31504

  • 13.48
  • 14.98
  • 22.98
  • 11.98
  • 15.98

31701 39.65 47.15 47.15 45.15 41.15 31805

  • 35.83
  • 44.33
  • 57.33
  • 40.83
  • 36.33

31922 6.47 4.47

  • 5.53

7.97 4.97 32013 10.42 9.42 2.42 6.42 5.92 34006

  • 14.04
  • 12.04
  • 19.54
  • 7.54
  • 12.04

34209

  • 38.05
  • 40.55
  • 57.55
  • 38.05
  • 35.55

34524 17.93 18.43 7.43 17.93 9.93 34610 6.50 6.00

  • 1.00

5.50 7.00 MAE 20.80 19.95 22.84 20.77 19.16

  • 5. Conclusions

In this paper, the droplet entrainment phenomena during a reflood phase of a large-break LOCA in a PWR was mechanistically modeled. We confirmed the existing droplet entrainment models applicable to the downstream of the QF did not properly reflect the actual entrainment phenomena. To complement this, the results of the visualization experiments for the post- dryout regime were used. Through the experiments, the entrainment phenomena on the core liquid jet and liquid sheet were shown, and these were modeled using instability analysis and correlations. The CUPID calculations were carried out for 14 tests of the FLECHT SEASET and 7 tests of the FEBA to evaluate the existing droplet entrainment models and the new

  • model. The results of the assessment show that the new

model can predict PCT and QT better than the existing models. Acknowledgements This research was supported by the National Research Foundation (NRF) grant funded by the Ministry of Science, and ICT of the Korean government (Grant code 2017M2A8A4015059) REFERENCES

[1] G. De Jarlais, M. Ishii, and J. Linehan. Hydrodynamic stability of inverted annular flow in an adiabatic simulation, Journal of heat transfer, Vol. 108, pp. 84-92, 1986. [2] M. Ishii, and G. De Jarlais. Flow regime transition and interfacial characteristics of inverted annular flow, Nuclear engineering and design, Vol. 95, pp. 171-184, 1986. [3] M. Ishii, and G. De Jarlais, Flow visualization study of inverted annular flow of post dryout heat transfer region, Nuclear Engineering and Design, Vol. 99, pp. 187-199, 1987. [4] M. Ishii, and James P. Denten. Two-phase flow characteristic of inverted bubbly, slug and annular flow in post-critical heat flux region, Nuclear Engineering and Design

  • Vol. 121, No. 3, pp. 349-366, 1990.

[5] I. Babelli, S.T. Revankar, and M. Ishii, Flow visualization study of post-critical heat flux in inverted flow, Nuclear engineering and design, Vol. 146, No. 1-3, pp. 15-24, 1994. [6] R.K. Salko, and M.N. Avramova, COBRA-TF Subchannel Thermal-Hydraulics Code (CTF) Theory Manual–Revision 0, CASL-U-2015-0054, 2015. [7] T. Yonomoto, A study of entrainment at a break and in the core during SBLOCA in PWR, JAERI-RESEARCH-96-024. Japan Atomic Energy Research Institute, 1996. [8] M.J. Holowach, et al., Modeling of droplet entrainment phenomena at a quench front, Int. J. Heat Fluid Flow, Vol. 24,

  • pp. 902-918, 2003.

[9] M. Valette, et al., Revisiting large break LOCA with the CATHARE-3 three field model, Nuclear Engineering and Design, Vol. 241, pp. 4487-4496, 2001. [10] J.J. Jeong, et al., The CUPID code development and assessment strategy, Nucl. Eng. Technol., Vol. 42, No. 6, pp. 636-655, 2010. [11] N. Lee, et al., PWR FLECHT SEASET unblocked bundle, forced and gravity reflood task data evaluation and analysis report, EPRI NP-2013/NUREG CR-2256/WCAP 9891, 1982. [12] P. Ihle, and K. Rust, FEBA-Flooding Experiments with Blocked Arrays Data Report 1, Test Series I through IV, Kernforschungszentrum Karlsruhe, 1984. [13] P.K. Senecal, et al., Modeling high-speed viscous liquid sheet atomization, International Journal of Multiphase Flow,

  • Vol. 25, pp. 1073-1097, 1999.

[14] USNRC, TRACE V5.0 Theory Manual, Field Equations, Solution Methods, and Physical Models, United States Nucl.

  • Regul. Comm, 2010.

Transactions of the Korean Nuclear Society Virtual Spring Meeting July 9-10, 2020