
SLIDE 1
Modelling binding site with 3DLigandSite Mark Wass - - PowerPoint PPT Presentation
Modelling binding site with 3DLigandSite Mark Wass m.n.wass@kent.ac.uk CASP MEEYKVVVCGSGPVALGCF Target sequence (2 per day) Human predictors Server predictors 3 days 3 weeks Predicted Binding site Results Predicted Performance
MEEYKVVVCGSGPVALGCF Target sequence (2 per day)
Predicted structure Predicted Binding site Assessment Results Performance Compared to
Human predictors Server predictors 3 days 3 weeks
Developed as a result of participation in CASP
MTEYKLVVVGAGGVGKSALTIQLIQ
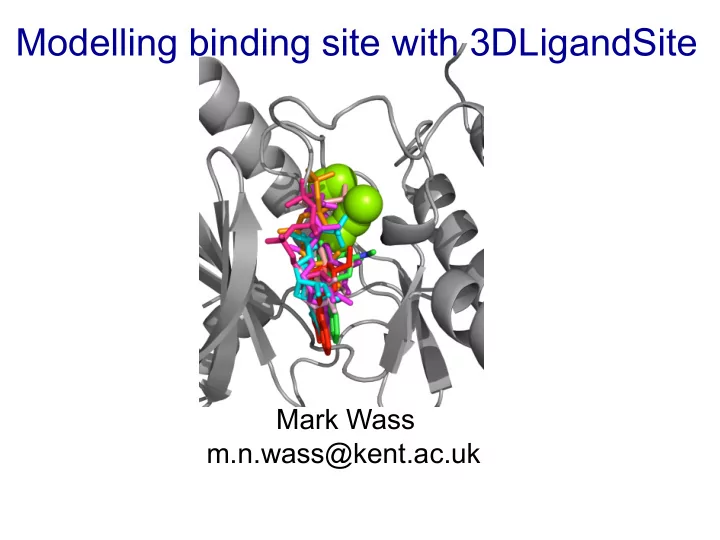
Homologous ¡structures ¡ 2oai ¡ 2pls ¡ 2p4p ¡ Calcium ¡ Magnesium ¡ Wass & Sternberg Proteins 2009 ¡
Homologous ¡structures ¡ 2pls ¡ 2p4p ¡ 2oai ¡ Calcium ¡ Magnesium ¡ Wass & Sternberg Proteins 2009 ¡
Homologous ¡structures ¡ 2p4p ¡ 2pls ¡ 2oai ¡ Calcium ¡ Magnesium ¡ Wass & Sternberg Proteins 2009 ¡
Homologous ¡structures ¡ 2p4p ¡ 2pls ¡ 2oai ¡ Calcium ¡ Magnesium ¡ Wass & Sternberg Proteins 2009 ¡
Homologous ¡structures ¡ Calcium ¡ Magnesium ¡ Wass & Sternberg Proteins 2009 ¡
Calcium ¡ True ¡posi4ve ¡ False ¡Posi4ve ¡ Wass & Sternberg Proteins 2009 ¡
MCC Sternberg group LEE group
Correlation coefficient –
statistically different.
statistically different to all other predictors (p <0.01). Adapted from Lopez et al., 2009 Groups
Automating our CASP8 approach
Wass et al., NAR 2010
Phyre2 Align homologous structures MAMMOTH search against Structural library Structural model
¡MTEYKLVVVGAGG ¡
User provided strcuture
Cluster ligands Select clusters Wass et al., NAR 2010 Make prediction Using selected Clusters
Phyre2 Align homologous structures MAMMOTH search against Structural library Structural model
¡MTEYKLVVVGAGG ¡
User provided strcuture
Cluster ligands Select clusters Wass et al., NAR 2010 Make prediction Using selected Clusters
Phyre2 Align homologous structures MAMMOTH search against Structural library Structural model
¡MTEYKLVVVGAGG ¡
User provided strcuture
Cluster ligands Select clusters Wass et al., NAR 2010 Make prediction Using selected Clusters
Phyre2 Align homologous structures MAMMOTH search against Structural library Structural model
¡MTEYKLVVVGAGG ¡
User provided strcuture
Cluster ligands Select clusters Wass et al., NAR 2010 Make prediction Using selected Clusters
Phyre2 Align homologous structures MAMMOTH search against Structural library Structural model
¡MTEYKLVVVGAGG ¡
User provided strcuture
Cluster ligands Select clusters Wass et al., NAR 2010 Make prediction Using selected Clusters
Predictions
Multiple molecules in cluster but where is the actual binding site?
Threshold for prediction = Contact 25% ligands
CASP8 targets (28)
Measure 3DLigandSite Human CASP8 MCC 0.64 0.63 Recall 71% 83% Precision 60% 56%
Measure 3DLigandSite MCC 0.68 Recall 70% Precision 70%
MCC – Matthews Correlation Coefficient Recall– percentage of binding sites that are predicted (TP/(TP+FN)) Precision– percentage of predicted residues that are correct (TP/(TP+FP))
Phyre2 Align homologous structures MAMMOTH search against Structural library Structural model
¡MTEYKLVVVGAGG ¡
User provided strcuture
Cluster ligands Select clusters Wass et al., NAR 2010 Make prediction Using selected Clusters
Paste sequence and Run
Or submit your own structure Retrieve results
Upload structure
JOB ID Submission type – sequence/structure
Phyre2 Align homologous structures MAMMOTH search against Structural library Structural model
¡MTEYKLVVVGAGG ¡
User provided strcuture
Cluster ligands Select clusters Wass et al., NAR 2010 Make prediction Using selected Clusters
Phyre2 Align homologous structures MAMMOTH search against Structural library Structural model
¡MTEYKLVVVGAGG ¡
User provided strcuture
Cluster ligands Select clusters Wass et al., NAR 2010 Make prediction Using selected Clusters
JOB ID –same as 3DLig job id Model confidence 0 (low) -100 (high) Similarity of structural hits (higher value = structures more similar) Min lnE value used = 7 Predictions using low LnE values e.g. < ~12-15 should be treated with caution
Phyre2 Align homologous structures MAMMOTH search against Structural library Structural model
¡MTEYKLVVVGAGG ¡
User provided strcuture
Cluster ligands Select clusters Wass et al., NAR 2010 Make prediction Using selected Clusters
Model confidence 0 (low) -100 (high)
Clusters ranked by number of ligands. Mammoth scores for cluster displayed to indicate how similar the structures are that contributed the ligands in the cluster. Top cluster displayed as main prediction. Click on rows to view predictions for the other clusters.
Phyre2 Align homologous structures MAMMOTH search against Structural library Structural model
¡MTEYKLVVVGAGG ¡
User provided strcuture
Cluster ligands Select clusters Wass et al., NAR 2010 Make prediction Using selected Clusters
Predictions
Lists the ligands that are present in the cluster and the structures that they are from
Predicted residue table
+vdw of 25% of cluster predicted
these ligands
(range 0 – 1).
prediction – e.g.
ligands
Control: ¡ Colouring ¡of ¡protein ¡– ¡by ¡predic4on ¡
¡ Display ¡of ¡protein: ¡ Spacefill/wireframe/cartoon ¡ ¡ Label ¡predicted ¡residues ¡so ¡they ¡can ¡ be ¡iden4fied ¡in ¡the ¡graphical ¡view. ¡ ¡ Separate ¡controls ¡for ¡display ¡of ¡ predicted ¡residues ¡ ¡ Modify ¡display ¡of ¡ligands: ¡ Spacefill/wireframe ¡ ¡ Overall: ¡ Make ¡protein ¡rotate ¡ Change ¡background ¡colour ¡ ¡
Metals found bound like this – with 3-6 residues Often the residues aren’t sequential Binding sites with a single residue contacting the ligand are likely to be wrong
Sometimes the cluster of residues might overlap with the protein structure as in the examples above. This is more likely where the cluster is close to a loop. The prediction may be good but it might also be slightly affected by the overlap of the cluster and the structure
2 ¡clusters ¡for ¡the ¡same ¡protein. ¡ ¡ ¡ Mul4ple ¡ligands ¡in ¡cluster ¡ Mul4ple ¡residues ¡contac4ng ¡ligand ¡ Looks ¡like ¡it ¡could ¡be ¡a ¡ligand ¡binding ¡site ¡ Divergence ¡colouring ¡help ¡suggest ¡residue ¡that ¡might ¡not ¡ be ¡part ¡of ¡the ¡binding ¡site. ¡ ¡ Single ¡ligand ¡in ¡cluster ¡ Single ¡residue ¡binds ¡the ¡ligand ¡ Unlikely ¡to ¡be ¡a ¡ligand ¡binding ¡site ¡ ¡
Site ¡only ¡binds ¡part ¡of ¡cluster ¡ Predic4on ¡viewed ¡with ¡other ¡chain ¡of ¡ dimer ¡from ¡one ¡of ¡the ¡templates ¡ When ¡predic4ons ¡only ¡seem ¡to ¡contact ¡part ¡of ¡the ¡ligand ¡in ¡some ¡example ¡this ¡is ¡because ¡ the ¡ligand ¡is ¡bound ¡between ¡chains ¡in ¡an ¡oligomer. ¡Therefore ¡part ¡of ¡the ¡binding ¡site ¡might ¡ be ¡missed. ¡Different ¡clusters ¡predicted ¡for ¡the ¡binding ¡site ¡may ¡predict ¡different ¡residues ¡ that ¡when ¡combined ¡contain ¡the ¡full ¡binding ¡site ¡
Large cluster of many different ligands. This is unlikely to be a binding site
Suggestions for interpreting results:
region to be a binding site
single metal ion
predictions
large are of the protein. Such a large site is likely to be incorrect, although part of it may be ligand binding.