MELCOR simulation of in-vessel mitigation strategies by multiple - - PDF document

melcor simulation of in vessel mitigation strategies by
SMART_READER_LITE
LIVE PREVIEW

MELCOR simulation of in-vessel mitigation strategies by multiple - - PDF document

Transactions of the Korean Nuclear Society Virtual Spring Meeting July 9-10, 2020 MELCOR simulation of in-vessel mitigation strategies by multiple actions using monte carlo method Wonjun Choi a , Sung Joong Kim a* a Department of Nuclear


slide-1
SLIDE 1

MELCOR simulation of in-vessel mitigation strategies by multiple actions using monte carlo method

Wonjun Choi a, Sung Joong Kima*

a Department of Nuclear Engineering, Hanyang University, 222 Wangsimni-ro, Seongdong-gu, Seoul 04763, Republic

  • f Korea

*Corresponding author: sungjkim@hanyang.ac.kr

  • 1. Introduction

Since the newly established nuclear safety legislation in 2015, adequate modeling of severe accident management guidance (SAMG) is one of the major issues in L2PSA [1]. To model adequate event tree (ET) for plant damage state (PDS) and containment event tree (CET) of L2PSA, the grouping logic diagram is typically used, and the simulation results of severe accident code can also be used to define the criteria for the grouping parameters. In case of the operator action time of SAMG, the only way to define the criteria is simulation of accident progress similar to the success criteria in L1PSA. In this study, the sensitivity study of operator action time for in-vessel mitigation strategies were performed to verify the group of accident progress. The progress of severe accident was simulated by MELCOR 2.2 code. The results were categorized depending on the implementation of mitigation strategies and occurrence

  • f reactor coolant system (RCS) failure.
  • 2. Methodology

2.1 Description of MELCOR input model The reference plants of MELCOR input model is

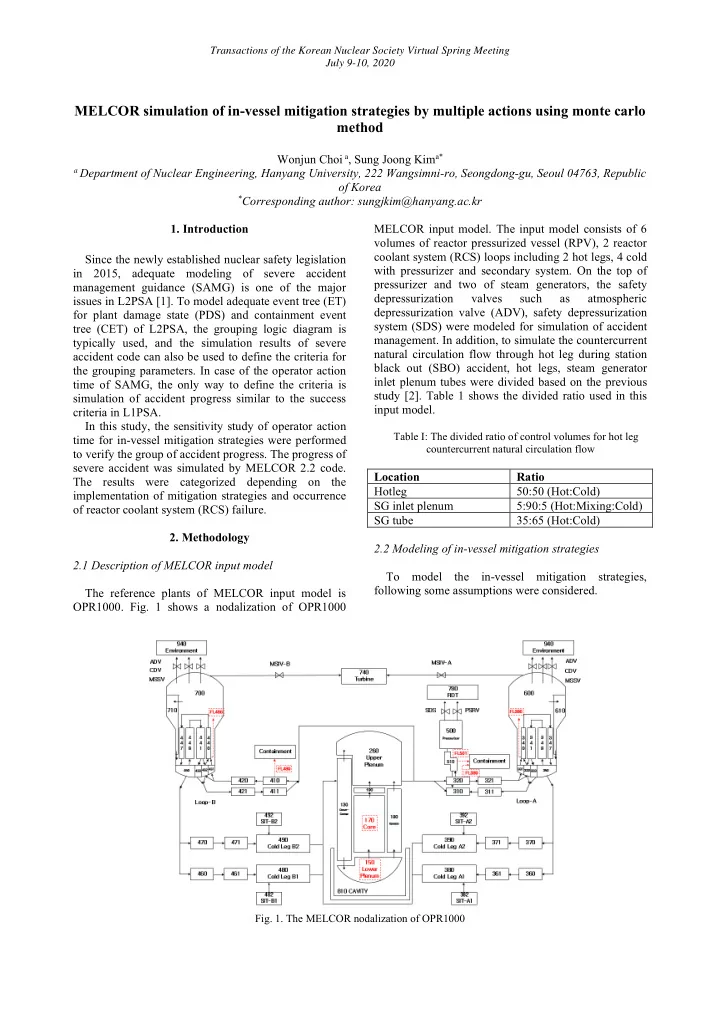
  • OPR1000. Fig. 1 shows a nodalization of OPR1000

MELCOR input model. The input model consists of 6 volumes of reactor pressurized vessel (RPV), 2 reactor coolant system (RCS) loops including 2 hot legs, 4 cold with pressurizer and secondary system. On the top of pressurizer and two of steam generators, the safety depressurization valves such as atmospheric depressurization valve (ADV), safety depressurization system (SDS) were modeled for simulation of accident

  • management. In addition, to simulate the countercurrent

natural circulation flow through hot leg during station black out (SBO) accident, hot legs, steam generator inlet plenum tubes were divided based on the previous study [2]. Table 1 shows the divided ratio used in this input model.

Table I: The divided ratio of control volumes for hot leg countercurrent natural circulation flow

Location Ratio Hotleg 50:50 (Hot:Cold) SG inlet plenum 5:90:5 (Hot:Mixing:Cold) SG tube 35:65 (Hot:Cold) 2.2 Modeling of in-vessel mitigation strategies To model the in-vessel mitigation strategies, following some assumptions were considered.

  • Fig. 1. The MELCOR nodalization of OPR1000

Transactions of the Korean Nuclear Society Virtual Spring Meeting July 9-10, 2020

slide-2
SLIDE 2

 To confirm the successful implementation of mitigation action and adverse effect, the

  • perator sequentially performed the mitigation

strategies one by one.  Therefore, next mitigation strategies should be performed after the satisfaction of the set point for previous mitigation strategy.  The timing of actions can be delayed by the decision making or recovery and operation of safety feature. In this study, the maximum delayed time was assumed 2 hours refer to recent study about validation of SAMG [3]. In this study, only 3 mitigation strategies for the in- vessel retention were considered with aforementioned assumption; Injection into SG (Mit-01), RCS depressurization (Mit-02), Injection into RCS (Mit-03).

  • Fig. 2 shows the schematic of in-vessel mitigation

strategies modeling for MELCOR simulation.

  • Fig. 2. the schematic diagram of in-vessel mitigation

strategies modeling

Table 2 shows the operator actions for each mitigation strategies. The external injection using fire engine was selected for injection into RCS and SG (Mit-01 & 03). The external injection rate for SG and RCS were determined by the previous study of Park [4]. To depressurize RCS & SG for injection, 1 ADV of each SG and 1 pilot operated relief valve of SDS was considered for the actions of Mit-01 & 02. 2.3 Random sampling for delay time of operator actions Typical sensitivity analysis using several points (ex. 10, 20, 30, 40 and 50 in range from 10 to 50) is highly useful in cases with a clear tendency. However, it can be hard to capture the trend in severe accident using typical sensitivity analysis due to the uncertainties of

  • results. Therefore, the monte carlo method was used in

this study to analyze the sensitivity of delay time for

  • perator actions. The delay time for each mitigation

strategy was sampled with the range from 0 min from to 120 min and combined as 300 sets of simulation using SNAP/DAKOTA plugin.

Table II: The operator actions for each mitigation strategies

Mitigation strategies Set point Operation actions Injection into SG (Mit-01) All SG water level < 63% External injection Open 1 ADV of each SG Depressurization RCS (Mit-02) RCS pressure > 2.86 MPa Open 1 PORV of SDS Injection into RCS (Mit-03) Core exit temperature > 644.1 K External injection

  • 3. Calculation results

3.1 Unmitigated accident scenario For a base case, SBO accident without accident management was selected. In this case, all of safety feature except safety injection tank (SIT) were

  • unavailable. Reactor trip was immediately initiated by

the insertion of control rod at loss of power. Because the auxiliary feed water (AFW) pump was unavailable, SG water dried out by the heat from RCS. After the loss

  • f secondary heat removal, the boiling of RCS coolant

increased RCS pressure, and caused opening of pressurizer safety relief valve (PSRV). Due to the release of coolant through PSRV, the core was uncovered and heat up. As a result, the core exit temperature (CET) reached to the SAMG entry condition (CET > 923 K) at 2.56 hours. At 3.07 hours, the hot leg creep rupture occurred by the hot gas circulation from the core. The coolant of SIT was injected after RCS failure with hot leg creep rupture. Nevertheless, RPV failure finally occurred at 6.94 hours. The detail time of accident progress summarized in Table III.

Table III: The accident progress of base case

Sequences Time (hours) Rx trip 0.0 All SG dryout 1.03 PSRV first open 1.38 Core uncovery 2.11 SAMG entrance 2.56 UO2 melt 3.00 Hot leg creep rupture 3.07 SIT injection 3.08 Melt relocation 6.56 RPV failure 6.94

Transactions of the Korean Nuclear Society Virtual Spring Meeting July 9-10, 2020

slide-3
SLIDE 3

3.2 The results of mitigation strategies Among the total 300 calculations, only 3 calculations were failed. The results of other 297 calculations were categorized by 3 groups as shows in table IV.

Table IV: The categories of the calculation results of mitigated accident cases

Category Mitigation strategies Creep rupture RPV failure # 1 Mit-01,02,03 No No 72 2 Mit-01,03 Hot leg No 41 3 Mit-01 Hot leg Failed 184 Total 297 This trend mainly affected by the delay time of

  • peration actions. Fig.3 shows the categories depending
  • n the delay time of Mit-01 & 03.
  • Fig. 3. The categories depending on the delay time of Mit-

01 and 03

In category 1, the maximum delay time of Mit-01 was about 1,800 sec which is the time between SAMG entrance (9,228 sec) and hot leg creep rupture (11,055 sec) in bases case. The secondary cooling by injection into SG recovered secondary cooling, and depressurize the RCS before the creep rupture. In addition, feed and bleed operation was performed by Mit-02 & 03. As a result, the CET decreased below the set point (CET > 644.1 K), and RPV failure was prevented. In category 2 and 3, the operator actions of Mit-01 was commonly performed after hot leg creep rupture. Although the pressure of RCS decreased enough to inject coolant, the delay time of Mit-03 caused the injection after RPV failure in category 3. In category 2, the operator actions of Mit-03 was performed before the RPV failure. The maximum delay time of Mit-03 for category 2 observed to have the linear trend about the delay time of Mit-01. However, the uncertainty of this trend was also observed. Therefore, the evaluation of uncertainty for observed linear trend should be needed for future work. The behaviors of water level of SGs, RCS pressure, and CET for representative cases of each category were shown in Fig. 4 – 6.

  • Fig. 4. The SG water level behavior of representative cases

for mitigated cases

  • Fig. 5. The RCS pressure behavior of representative cases

for mitigated cases

  • Fig. 6. The CET behavior of representative cases for

mitigated cases Transactions of the Korean Nuclear Society Virtual Spring Meeting July 9-10, 2020

slide-4
SLIDE 4

3.3 Discussion of the results for CET of L2 PSA Fig 6. shows the decomposition event tree (DET) for MELTSTOP heading [5]. The DET of MELTSOP categorized the in-vessel corium coolability depending

  • n the status of in-vessel injection (INVESSINJ), RCS

pressure before vessel breach (RCSPRESS), and containment heat removal (CSRCOOL). Each condition is defined as follows:  INVESSINJ: ‘ON’ (Success of in-vessel injection), ‘DEADHEADED’ (In-vessel injection is ready, but failed by high RCS pressure), and ‘Failed’ (In-vessel injection failed).  RCSPRESS: ‘NOT LOW’ (RCS pressure > 14.1 kg/cm3), and ‘LOW’ (RCS pressure < 14.1 kg/cm3).  CSRCOOL: ‘YES’ (Success of containment heat removal by spray), and ‘No’ (Containment heat removal failed). With these conditions, the basic PSA analysis cases were defined as shown in table V. The categories in this study can be corresponding to Case A (Category 1), Case C (Category 2), Case D (Category 3). Although additional study should be required, it means that the modeling of in-vessel mitigation strategies can be possible using existing CET of L2 PSA. For this application, the criteria for classifying category 2 and category 3 in PDS-ET should be developed as a function of operator action time.

Table V: The basic PSA analysis cases for MELTSTOP [5]

  • 3. Conclusions

The SBO accident with in-vessel mitigation strategies was simulated by MELCOR 2.2 code. The sensitivity analysis of operator action time using month carlo

  • method. The major finding of the results can be

summarized as follows: (1) The accident progress of SBO accident with in- vessel mitigation strategies can be categorized depending on operator action time for Mit-01 & 03. (2) When the sequential application of in-vessel mitigation strategies was considered, the maximum time for Mit-03 was depend on Mit-01 which is the previous action. (3) The categories in this study were similar with the existing basic L2PSA analysis cases for MELSTOP heading. Therefore, application of existing CET can be possible for in-vessel mitigation strategies. In this case, the criteria for classifying categories should be developed as a function of operator action time. ACKNOWLEDGMENTS This work was supported by the National Research Foundation of Korea (NRF) funded by the Ministry of Science & ICT (MSIT, Korea) [grant numbers NRF- 2017M2A8A4018213] REFERENCES

[1] J. Kim, J. Cho and K. Lee, Human Reliability Analysis for Level 2 PSA: Qualitative Information Analysis of Severe Accident Management Guidelines under Postulated Accident

  • Scenarios. Transactions of Nuclear Society Spring Meeting,

Jeju, Korea, May 23-24, 2019 [2] G. Jung et. al., Development of MELCOR 1.8.6 Input Decks for the OPR1000 Level 2 Phenomenological Uncertainty Analysis (I), KAER/TR-4113, 2010 [3] Y. Lee et. al., Validation of severe accident management guidelines (SAMGs) for advanced power reactor 1400 (APR1400) using colored Petri net (CPN) Tools, Annals of Nuclear Energy, Vol. 126, pp. 186-193 (2019) [4] S. Park and K. Ahn, Evaluation of an accident management strategy of emergency water injection using fire engines in a typical pressurized water reactor, Nuclear Engineering and Technology, Vol. 47, pp. 719-728 (2015) [5] KHNP, Probabilistic Safety Assessment report for Shin- Kori Unit 1&2, Korea Hydro and Nuclear Power Corporation, 2010 Transactions of the Korean Nuclear Society Virtual Spring Meeting July 9-10, 2020