MELCOR Analysis of a Spray Experiment in the SPARC Test Facility - - PDF document

melcor analysis of a spray experiment in the sparc test
SMART_READER_LITE
LIVE PREVIEW

MELCOR Analysis of a Spray Experiment in the SPARC Test Facility - - PDF document

Transactions of the Korean Nuclear Society Virtual Spring Meeting July 9-10, 2020 MELCOR Analysis of a Spray Experiment in the SPARC Test Facility Hyoung Tae Kim and Jongtae Kim Accident Monitoring and Mitigation Research Team, KAERI,


slide-1
SLIDE 1

MELCOR Analysis of a Spray Experiment in the SPARC Test Facility

Hyoung Tae Kim and Jongtae Kim Accident Monitoring and Mitigation Research Team, KAERI, Daeduk-daero 989-111, Daejeon, Korea

*Corresponding author: kht@kaeri.re.kr

  • 1. Introduction

The operation of spraying in a containment during severe accidents, especially under the condition of release of hydrogen, affects the behavior of hydrogen simultaneously with fulfilling the inherent objectives of depressurization and pressure control in the containment [1]. Therefore, the spray experiments in the SPARC (SPray-Aerosol-Recombiner-Combustion) [2] test facility were performed to understand well the hydrogen behavior affected by a spray activation in the

  • containment. These experiments on the operation of

spray under hydrogen release conditions confirmed that the mixing of hydrogen induced by spray droplets behavior is more dominant than the local increase of hydrogen concentration by steam condensation. It was also found that the mixing of hydrogen by spray actuation lowered the hydrogen removal rate of the PAR by a reduced hydrogen concentration at the PAR inlet. In this study one of experiments for hydrogen injection with activation of a spray system are simulated by the MELCOR 1.8.6 [3] to compare the code results with experimental data. With the MELCOR analysis of a spray experiment, the containment analysis code can be assessed to remove the uncertainties of the code models regarding spray actuation phenomena in the containment.

  • 2. MELCOR Modeling of a PAR Experiment

2.1 Overview of spray experiments in the SPARC A series of spray experiments [2] were performed in the SPARC test facility including a pressure vessel with 3.4 m diameter, 9.5 m height. Two kinds of the SPARC spray experiments were conducted focusing on two different phenomena. The first experiment is the SPARC-SPRAY (SS) experiment, which evaluates the effect of the spray operation during hydrogen injection on the hydrogen distribution, and the second one is SPARC-SPRAY-PAR (SSP), which evaluates the effect of the water spray on the operation

  • f the PAR. The MELCOR analysis in the present study

is performed with the database of the SSP experiment. As the injection of hydrogen initiates the PAR actuation, the exhaust gas including hot water vapor is released at exit of PAR. The PAR chamber produces a flow that is raised by the chimney effect and the incoming flow is created at the entrance of the PAR. Operation of the spray may interfere with the flow induced by the PAR by lowering the temperature of the exhaust gas and condensing the water vapor contained in the exhaust gas. Conversely, a downward flow driven by a spray droplet may produce a positive effect on the gas flow inside the PAR by raising the gas flow surrounding the PAR. The purpose of this experiment is to manage the

  • peration and hydrogen control of the PARs more

efficiently through the experimental reproduction of the phenomena that we anticipate,

  • r

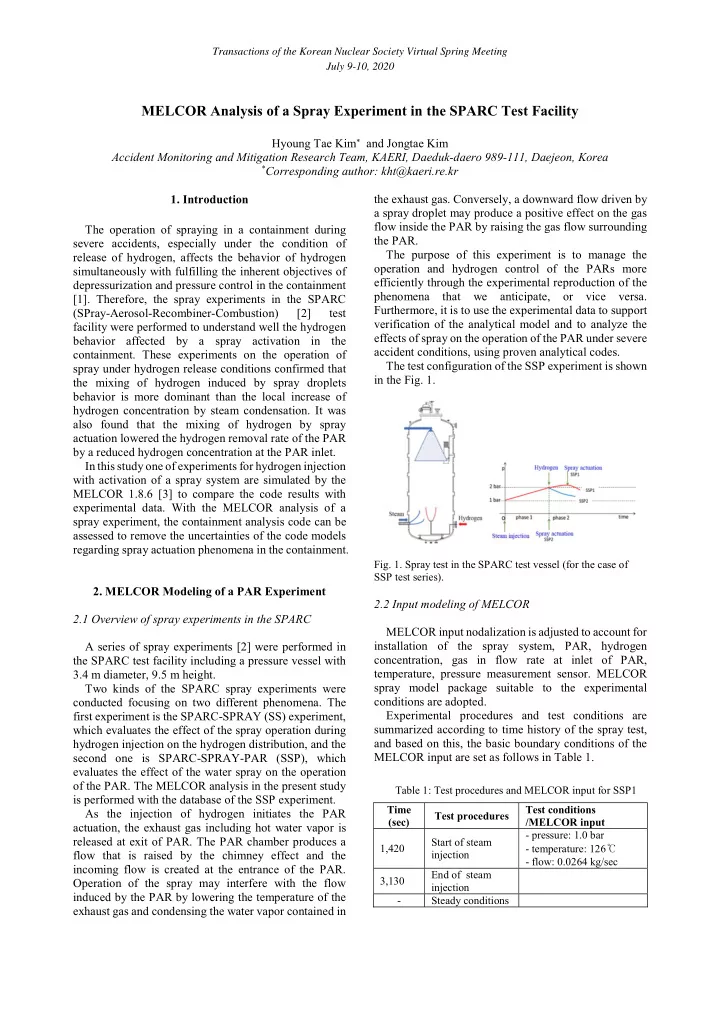
vice versa. Furthermore, it is to use the experimental data to support verification of the analytical model and to analyze the effects of spray on the operation of the PAR under severe accident conditions, using proven analytical codes. The test configuration of the SSP experiment is shown in the Fig. 1.

  • Fig. 1. Spray test in the SPARC test vessel (for the case of

SSP test series).

2.2 Input modeling of MELCOR MELCOR input nodalization is adjusted to account for installation of the spray system, PAR, hydrogen concentration, gas in flow rate at inlet of PAR, temperature, pressure measurement sensor. MELCOR spray model package suitable to the experimental conditions are adopted. Experimental procedures and test conditions are summarized according to time history of the spray test, and based on this, the basic boundary conditions of the MELCOR input are set as follows in Table 1.

Table 1: Test procedures and MELCOR input for SSP1 Time (sec) Test procedures Test conditions /MELCOR input 1,420 Start of steam injection

  • pressure: 1.0 bar
  • temperature: 126℃
  • flow: 0.0264 kg/sec

3,130 End of steam injection

  • Steady conditions

Transactions of the Korean Nuclear Society Virtual Spring Meeting July 9-10, 2020

slide-2
SLIDE 2

5,675 Start of H2 injection

  • flow: 0.6 g/sec

6,680 End of H2 injection

  • 6,709

Start of spray actuation

  • flow: 0.197x10⁻³ m3/sec
  • temperature: 52.7 ℃

11,609 End of spray actuation

Heat structures capable of simulating heat losses on the outer walls of the test vessel are modeled. In particular, the temperature boundary condition is properly given to the outer wall and the heat transfer coefficient boundary condition is set on the inner wall to compensate for the pressurization and temperature rise conditions of the internal vessel due to the injection of steam and hydrogen. When gas is injected into an enclosed pressure boundary of vessel in the MELCOR calculation, excessive temperature increase is predicted. Therefore, this over-prediction is adjusted by controlling the heat loss as shown in Table 2.

Table 2: Heat structure boundary conditions (for heat loss

  • f outer wall of the test vessel)

Parameter Value Thickness (mm) 25 Cp (J/kg/K) 510  (wall density, J/kg/K) 7970 K (conductivity, W/m/K) 15 Heat transfer rate on the inner surface (W/m2/K)

  • 1. Steam injection: 8.0
  • 2. H2 injection: 100.0
  • 3. Steady state: 20.0
  • 4. Spray actuation: 100.0

Outer wall temperature (K) 399.15

The change in hydrogen flow rate injected into the SPARC vessel is sensitive to pressure changes and, in

  • rder to accurately reflect this, the measured hydrogen

flow data are fitted and reflected in the MELCOR flow boundary conditions as shown in the Fig. 2.

  • Fig. 2. Hydrogen injection flow data and MELCOR input.
  • 3. Code Analysis Results

The procedure in the SPARC-Spray experiment shows that during the steam injection period of approximately 1,600 seconds, the pressure rises from 1.0 bar to 2.0 bar. After about 3,000 seconds of stabilization, hydrogen is injected for about 1,000 seconds, which causes the SPARC vessel to be pressurized. The spray system is actuated to de-pressurize the vessel as soon as hydrogen injection is completed. The results of the MELCOR analysis are compared with the test results in the Fig. 3. The results of the MELCOR analysis reflected the following characteristics of the test results.

  • Linear pressure increase due to constant water vapor

injection (1.0 bar → 2.0 bar)

  • Variation of pressure increase due to hydrogen

injection (with proper heat loss and accurate data fitting for injection flow rate)

  • Rapid de-pressurization as soon as spray injection

begins, and subsequent re-rising and moderate decrease of pressure

  • Fig. 3. Comparison of gas pressure inside the test vessel

between test data and MELCOR prediction.

The Fig. 4 compares the behavior of the temperature change in the test results with that of the MELCOR analysis

  • Fig. 4. Comparison of gas temperature inside the test vessel

between test data and MELCOR prediction.

The results of the MELCOR analysis reflected the following characteristics of the test results.

Transactions of the Korean Nuclear Society Virtual Spring Meeting July 9-10, 2020

slide-3
SLIDE 3
  • Increase of gas temperature in the SPARC vessel by

injection of steam and recover of temperature (126°C) during stabilization period

  • Rapid increase of gas temperature inside of the vessel

due to PAR operation with hydrogen injection started

  • Rapid temperature decrease immediately after

spraying and subsequent behavior

  • f

mild temperature decrease During the hydrogen injection period, natural circulation flow of the mixture of hydrogen and steam is formed due to the operation of the PAR. The Fig. 5 compares the vane flow meter reading at the PAR inlet with the MELCOR prediction at the flow path of corresponding cell connections. Since measurement of the vane flow meter has the low limit of velocity value

  • f 0.4 m/sec, the MELCOR prediction value is very

similar to the experimental result except the velocity perturbation measurement of 0.4 m/sec or less, which is

  • bserved prior to the start of hydrogen injection (5,675

seconds). MELCOR analysis results are in well agreement with maximum velocity

  • f

hydrogen mixture gas, approximately 0.8 m/sec, and also the behavior of velocity change as follows:

  • Characteristic of rapid increase in inflow velocity

following the start of the PAR operation after hydrogen injection

  • Temporal increase of the natural circulation flow due

to rapid cooling of upper gas field at the beginning of spray injection

  • Gradual reduction of PAR inlet flow rate due to

reduction of hydrogen/PAR reaction and internal temperature differences during the spray injection

  • Fig. 5. Comparison of PAR inlet flow between test data and

MELCOR prediction.

If we see the changes in hydrogen concentration in the SPARC vessel due to the operation of the hydrogen control system, PAR and the spray injection system, as shown in the following figure, the MELCOR prediction follows the overall trend of increase and decrease of hydrogen concentration, but the following differences can be found.

  • The measurement of high hydrogen concentration due

to the presence of local hydrogen jets at the bottom (CV 300 area) near the hydrogen injection tube is not well predicted by the lumped code such as the MELCOR code

  • The hydrogen concentration measurement (H1) at the

bottom of the SPARC container (CV 100 area) begins to increase later than other areas because hydrogen fills the upper space first at the time of hydrogen

  • injection. It is only about 7,400 seconds that

hydrogen concentration is uniformly distributed throughout the internal regions of the vessel, but MELCOR does not reflect these test results

  • The distribution of maximum hydrogen concentration

values at each measurement position is not accurately predicted

  • Fig. 6. Comparison of H2 concentration inside the test vessel

between test data and MELCOR prediction.

  • 3. Conclusions

The spray experiment in the SPARC is conducted to simulate the condensation of steam by spraying and the behavior of hydrogen upon release of hydrogen-steam, and the input model for this simulation using MELCOR 1.8.6 has been assessed against the test data. For this purpose, the input for MELCOR analysis of the spray experiment is prepared to reflect changes in instrument location and installation of hydrogen control systems, such as spray and PAR. For the future work, the sensitivity analysis on the input factors of the MELCOR spray power package will be conducted to compensate for changes in pressurization and temperature in the experimental vessel resulting from the injection

  • f

water vapor/hydrogen, and to adequately simulate the decompression and cooling effects of spray operation. ACKNOWLEDGMENTS This work was supported by the National Research Foundation of Korea (NRF) grant funded by the Korea government (Ministry

  • f

Science, ICT) (No. 2017M2A8A4015277) REFERENCES

[1] H. T. Kim, J. Kim, S. B. Kim, and S-W Hong, SPRAY Experimental Status in Nuclear Power Plants and KAERI Spray Experiment, KAERI/TR-7861/2019. [2] J. Kim, S-H Hong, K-H Park, J-H Kim, J-Y Oh, H. T. Kim,

  • S. B. Kim, S-W Hong, and Y. S. Na, Experimental Study of

Hydrogen Behaviors Affected by Pressure Control Systems in a Reactor Containment, KAERI/TR-7991/2019. [3] R. O. Gauntt, et al., MELCOR Computer Code Manuals, NUREG/CR-6119, Vol. 1, Rev. 3, SAND2005-5713. Transactions of the Korean Nuclear Society Virtual Spring Meeting July 9-10, 2020