
SLIDE 1
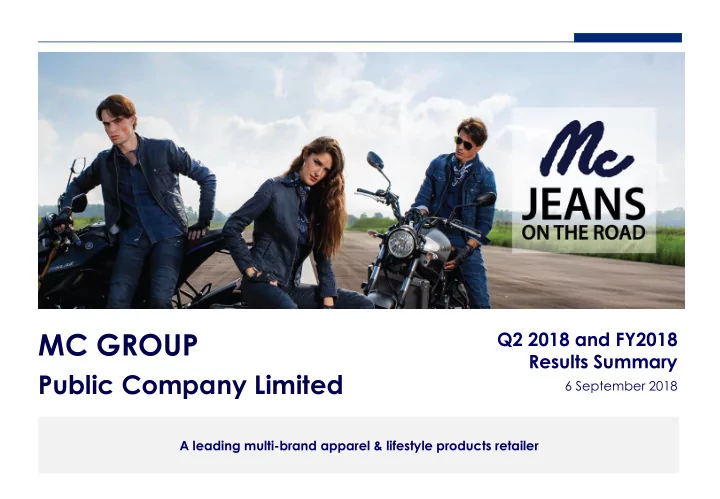
MC GROUP
Public Company Limited
Q2 2018 and FY2018 Results Summary
6 September 2018 A leading multi-brand apparel & lifestyle products retailer
MC GROUP Q2 2018 and FY2018 Results Summary Public Company Limited - - PowerPoint PPT Presentation
MC GROUP Q2 2018 and FY2018 Results Summary Public Company Limited 6 September 2018 A leading multi-brand apparel & lifestyle products retailer DISCLAIMER The information contained in our presentation is intended solely for your personal
6 September 2018 A leading multi-brand apparel & lifestyle products retailer
1
The information contained in our presentation is intended solely for your personal reference only. In addition, such information contains projections and forward-looking statements that reflect our current views with respect to future events and financial performance. These views are based on assumptions subject to various risks and uncertainties. No assurance is given that future events will occur, that projections will be achieved, or that the our assumptions are correct. Actual results may differ materially from those projected.
2
Company Overview
Recent Development
Financial Result
2019 Guidance
3
Launched
JV with Phetkasem Holding to revolutionize top wear
2008
Opened the first Free Standing Shop
1st Mc Shop 2012 Expanded to Myanmar & Laos
2005
Launched “Mc ” brand 2013
Extended Brand Portfolio
Casual menswear Women's’ Jeans & Street wear
Extended Brand Portfolio
Acquired 51% in
1975
Expanded to Lifestyle Business
Kid’s Jeanswear Fashionable Ladies wear Value-for-Money Casual wear Premium Jeanswear
Started as manufacturing and selling through traditional trade Onto managing brands and distribution channels Emerged as a leader in denim market in Thailand 2014 2015 Expanded to Vietnam Expanded to Cambodia Alliance with PTT
Opened mc mc shop in PTT gas station
Listed on the SET
Extended Brand Portfolio 2016 Extended Brand Portfolio
Active wear “UP” Skin care “M&C”
Set up new subsidiary 2017
Invested 55% in to distribute home spa products
Expanded to Iran
Revamped e-commerce platform
CRM & membership program
2018 Moving forward to become a leading apparel and lifestyle products retailer
4
WoWme Limited (“WOWME”) Look Balance Co.,Ltd Winnerman Co., Ltd. (“WNM”) MC INTER LIMITED (“MCI”) P.K. Garment (Import-Export) Co., Ltd. (“PKG”) 99.97% 99.98% 99.97% 99.97% 99.99%
50% of total production
privilege
Mc Jeans Manufacturing Co., Ltd. (“MJM”) 99.97%
20% of total production
privilege
Thai and foreign brands products and services through online platform
force and warehouse workforce for MC
the future business and investment abroad
Time Deco Corporation Co., Ltd.
51%
retailer and exclusive distributor of famous int’l watch brands
New Businesses Operations Production
Mc Jeanious Co., Ltd. 99.99% Top T 2015 Co., Ltd.
51%
wear with latest fabric technology under the brand “McT”
MC GROUP PLC (“MC”)
Registered Capital 400 MB Paid-up Capital 400 MB Aromatique Active Co., Ltd. 55%
and aromatic products
5
Located mainly in commercial centers or in the plaza sections of department stores as well as hypermarket and PTT gas station New sales channel that helps expand the reach to customers as well as build brand recognition Points of sales or sales counters in department stores (both chain and local non-chain) as well as hypermarket
(Songkla, Pattani) (Lampang)
Currently, expanded through distributors with presence in CLMV and Iran.
PoS
FY2018
(Jan-Jun)
6
FY2018 (Jan-Jun) Geographical Analysis of Outlets FY2018 (Jan-Jun) Geographical Analysis of Sales Greater Bangkok 28% Upcountry 70% International 2% Greater Bangkok 39% Upcountry 60% International 1%
819 694 511 446 Points of Sales 897 894 866
7
Outlet numbers adjusted to align with growth for Mc and efficiency for Timedeco
Mc Y14 Y15 Y16 Y17 FY18 Free-standing Shop 232 263 282 285 288 Modern Trade 472 467 477 488 493 Mobile Unit 5 5 6 6 6 Total POS (Domestic) 709 735 765 779 787 International markets 21 23 25 13 14 Total 730 758 790 792 801 Timedeco Free-standing Shop 19 25 21 15 14 Modern Trade 70 83 86 87 79 Total 89 108 107 102 93 Total overall 819 866 897 894 894
89 108 107 102 93 730 758 790 792 801 200 400 600 800 1000 Y14 Y15 Y16 Y17 FY18 (June)
MC TDC
Points of Sale
8
9
▪ Fiscal year changed from December to June ▪ Share customer base with alliance ▪ Continuously engage 4 target customer segments through new product developments & activities ▪ Strengthen products portfolio and enhance customer reach for better online shopping experience ▪ Nurture international market for medium to long term growth ▪ Re-launch new activewear collection U-P ▪ Turn “mcmc” to “mcmc outlet” store
10
MC Club’s members
Progress and indicative projection - year 2018
222,000 297,000 372,000 420,000 May Jun Jul Aug Sep
Forecast = >450K
▪ Strong growth in number of members which expected to reach >500K by the end of the year 2018 Membership means more… Members can enjoy special deals & offers all year. Sign up today at https://mcclub.mcshop.com/user FREE!
Billboard
▪ Continuously communicate with biker communities ▪ Launched new bikers product
✓ Video clip on social media ✓ Micro/macro -influencer ✓ Events with Yamaha
11
12
Gift with minimum purchase “Sarus rice” Gift with minimum purchase traditional loincloth Queen’s birthday special promotion
13
2018 FIFA world cup collection Concert co-sponsor with fun activities ‘Back to Basic’ T-shirt with good feedback by micro- influencer ‘Selvedge walker’ Mc sneaker – 2nd lot from high demand and recommend by customer reviews
14
▪ Launched “Mc to Campus” events ▪ Establish brand awareness and create brand loyalty Launched new product for college wear
15
Wear to work concept
Exchange customer base by co-brand promotion with selected partners ‘Anti Mosquito’ shirt with innovative repellent fabric
Mc x Beauty Buffet promotion at shops!
16
‘Mono brand’ Store (new) in addition to multi-brand store
Engaged by member card and celebrities
Engaged by blogger, influencer via social media
17
18
Brand building activities Baan Lae Suan Fair at BITEC exhibition center, Bangkok
Latest distribution channel via “TV Shopping” @GCJ O shopping
within
19
Expand products variety…
21
Apparel Health and Beauty Cosmetic and Skincare Watches Kitchenware
22
Ship to Shop
23
Awareness
24
CSR Program ▪ To build a good relationship with local people ▪ Supporting flood victim in Laos Social media marketing activity: ▪ To increase brand awareness and customer engagement
25
MDL8 branch Jeans zone at Junction Square, Yangon
New POS in Mandalay (Total 8 POS as of now)
Offline channels numbers adjusted to align with strategy
End of 2017 # Points of sales
End of 2018 (Jan-Jun) # Points of sales
Remark: Mc POS (Opened 15 and closed 7 (from consolidated 2 POS and lease-ended 4 POS)
Online channels
# Points of sales
Brand Free- Standing Modern Trade Mobile unit
International
Total 267 488 6 13 774 18 18 15 87 102 Total 300 575 6 13 894
+ 8 Mc, +1 Mc International and -9 Timedeco
26
Brand Free- Standing Modern Trade Mobile unit
International
Total 270 493 6 14 783 18 18 14 79 93 Total 302 572 6 14 894
Offline – nationwide coverage in FY19 (Jul18-Jun19)
27
Fun Cool Energy Minimal
Find ‘Warrix U-P’ collection SOON!...
28
Target Location Comfort
Variety of products and brands, suitable with all ages and genders End of season 50% - 70% discount
lifestyle products at affordable price
Located close to communities with parking space
building in local communities
mcmc outlet store
Q 2 / 2 0 1 8 & F Y 2 0 1 8 ( J a n – J u n )
29
30
(THB millions)
Q2/17 Q2/18 % YoY 6M17 6M18 % YoY
Sales Revenue
919 861
2,139 1,974
Total Revenue
930 869
2,161 2,014
Gross Profit
468 495 +6% 1,092 1,129 +3%
EBITDA
149 159 +7% 441 454 +3%
Net Profit
90 118 +31% 321 350 +9%
Gross Profit Margin
50.9% 57.5% 51.0% 57.2%
Net Profit Margin
9.7% 13.5% 15.0% 17.4%
EPS (THB)
0.11 0.15 0.40 0.44
NOTE: MC Group Public Company Limited and its subsidiaries (“MC” or “the Company”) have announced the approval of resolution to change in accounting period starting from 1st January to 31st December of every year to the period from 1st July to 30th June of next year, starting from the period ended 30th June, 2018 onward which will be for the 6 months period (starting from 1st January to 30th June 2018).
(THB millions)
Annual Sales Revenue Quarterly Sales Revenue Sales revenue by channel
Y2017(6M) FY2018(6M)
Others = E-Commerce, International, Mobile, Outside promotion, Factory sales 31
Free standing 61% Modern trade 33% Others 6%
60% 34% 6%
1,220 919 903 1,187 1,113 861 Q1/17 Q2 /17 Q3/17 Q4/17 Q1/18 Q2/18
NOTE: Due to changing fiscal year end from December to June, ratios of FY18 (Jan-Jun) will be compared with the 6-month period of prior year.
Modern trade (1)
’000 THB
Free standing shop
THB
Remark: (1) Figures are calculated based on modern trade sales revenue, before GP. Excluded sales from international markets and other source (i.e., exhibition etc.)
32
SSSG Quarterly SSSG (YoY)
Remark: Hypermarkets are not included in the calculation in SSSG.
33
(THB millions)
Gross Profit Gross Profit Margin Gross Profit Margin (excl TDC)
34
+3.4% YoY +5.8% YoY
SG&A breakdown % SG&A expense to sales
(THB millions)
35
374 367 367 447 389 372 386 481 400 382 760 782 33% 36% 42% 32% 32% 40% 43% 41% 36% 44% 36% 40% 0.0% 5.0% 10.0% 15.0% 20.0% 25.0% 30.0% 35.0% 40.0% 45.0% 50.0% 100 200 300 400 500 600 700 800 900 Q1 Q2 Q3 Q4 Q1 Q2 Q3 Q4 Q1 Q2 17 18 Y16 Y17 Y18 YTD YTD SG&A % SG&A to sales
Personnel 43% Advertising and Promotion 8% Rent 29% Depreciation and Amortization 8% Others 12% +2.6% YoY +2.8% YoY
(THB millions)
65.0%
EBITDA EBITDA Margin EBITDA Margin (excl TDC)
259 250 175 415 292 149 137 271 295 159 22.5% 24.7% 19.7% 29.0% 23.7% 16.0% 15.0% 21.8% 25.8% 18.3%
24.3% 25.8% 21.5% 30.7% 25.3% 16.6% 15.2% 22.5% 26.7% 20.2%
0.0% 5.0% 10.0% 15.0% 20.0% 25.0% 30.0% 35.0% 40.0% 45.0% 50.0% 200 400 600 800 1,000 1,200 1,400Q1 Q2 Q3 Q4 Q1 Q2 Q3 Q4 Q1 Q2 Y16 Y17 Y18 898 928 1,098 848 454 25.7% 23.6% 24.5% 19.7% 22.6%
0.0% 5.0% 10.0% 15.0% 20.0% 25.0% 30.0% 35.0%FY14 FY15 FY16 FY17 FY18 (6M)
36
+3.0% YoY +6.7% YoY
712 732 843 609 350 20.1% 18.5% 18.8% 14.1% 17.4%
FY14 FY15 FY16 FY17 FY18 (6M) 202 191 132 317 232 90 94 194 232 118 17.6% 18.8% 14.9% 22.2% 18.8% 9.7% 10.4% 15.6% 20.3% 13.5% 19.5% 20.5% 16.8% 23.8% 20.4% 10.5% 11.1% 16.6% 21.5% 15.3%
0.0% 5.0% 10.0% 15.0% 20.0% 25.0% 30.0% 35.0% 200 400 600 800 1,000 1,200Q1 Q2 Q3 Q4 Q1 Q2 Q3 Q4 Q1 Q2 Y16 Y17 Y18
(THB millions)
37
+8.8% YoY +31.0% YoY
Consolidated balance sheet Net debt to equity ratio
38
(THB millions)
2017 FY2018 (6M) Cash & Short term investmen 971 1,011 Accounts Receivable 552 382 Inventory 2,216 2,145 Other Assets 1,342 1,289 Total Assets 5,082 4,827 Accounts Payable 381 210 Interest-bearing Liabilities 95 16 Other Liabilities 438 321 Total Liabilities 913 547 Shareholders' Equity 4,168 4,280
ROA ROE Finished Good Inventory Days Cash Cycle
(THB millions) (THB millions) (Months) (Months)
39
9.8 11.9 11.9 12.1 14.2 11.5 12.4 13.2 11.9 9.6 10.7 12.0 12.1 13.3 14.2
14 15 16 17 18 Q1 Q2 Q3 Q4 Q1 Q2 Q3 Q4 Q1 Q2 Y16 Y17 Y18
Cash cycle (months) 10.1 12.6 12.1 12.5 14.4 11.5 12.2 13.3 12.1 9.1 10.8 12.3 12.5 13.6 14.4 14 15 16 17 18 Q1 Q2 Q3 Q4 Q1 Q2 Q3 Q4 Q1 Q2 Y16 Y17 Y18 FG inventory days (months)
4,279 4,152 3,967 4,286 4,521 4,214 3,952 4,168 4,406 4,280
20% 20% 18% 21% 22% 16% 14% 15% 23% 17%
0% 5% 10% 15% 20% 25% 1,000 2,000 3,000 4,000 5,000 6,000Q1 Q2 Q3 Q4 Q1 Q2 Q3 Q4 Q1 Q2 Y16 Y17 Y18
Total Equity ROE
5,048 4,828 4,724 5,196 5,355 5,091 5,030 5,082 5,219 4,827
16% 16% 14% 16% 18% 12% 11% 12% 18% 14%
0% 2% 4% 6% 8% 10% 12% 14% 16% 18% 20% 1,000 2,000 3,000 4,000 5,000 6,000Q1 Q2 Q3 Q4 Q1 Q2 Q3 Q4 Q1 Q2 Y16 Y17 Y18
Total Assets ROA
Dividend policy is not less than 50% of net profit
40
Stock Information Shareholder Structure Dividend Information
Local Institutional 17% Retail 18% Major shareholder 46% Foreign Institutional 19%
DPS : THB 0.40 XD : 6 Nov 2018 Record date : 7 Nov 2018 Payment : 28 Nov 2018 Announced dividend payment for the performance during 1 Jan to 30 Jun 2018 as follows: Bloomberg/ Reuters : MC TB/ MC.BK Share price (August 31, 2018) : THB 13.10 52 week range : THB 17.20/ THB 11.20
: 800 m Par value : THB 0.50 Market capitalization : THB 10,480 m
: THB 28.0 m
: THB 12.7 m Free float : 43.1% Foreign ownership/ Limit : 19.0% /49.0% Major shareholder :
0.80 0.75 0.90 0.75 0.40 90% 82% 85% 98% 92%
0% 20% 40% 60% 80% 100% 120%FY14 FY15 FY16 FY17 FY18 (6M) DPS (THB) Payout ratio
41
97%
3%
Y2012
Sales revenue contribution by product type
42
Sales growth Gross profit margin Dividend payout : 5 % : 57 % : Not less than 50 % CAPEX : THB 80-100 mn
60% 28% 9% 3%
Y2018 (Jan-Jun)
55% 28% 8% 9%
Y2021F
Investor Relations MC GROUP Public Company Limited ir@mcgroupnet.com Tel: +662 117-9999 Ext 1210
Line ID: @mc_jeans www.mcshop.com www.mcgroupnet.com
43