
SLIDE 1
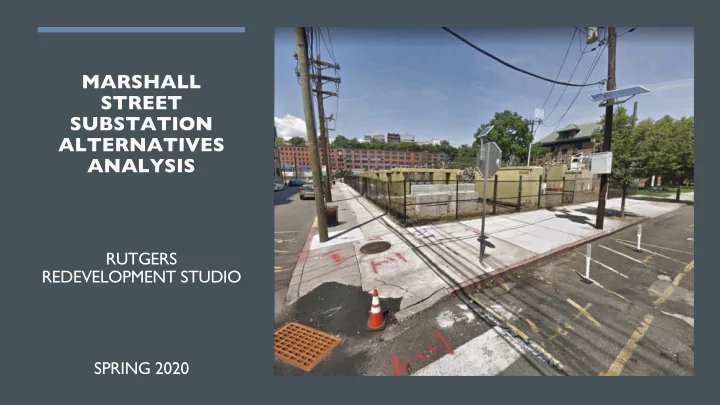
MARSHALL STREET SUBSTATION ALTERNATIVES ANALYSIS
RUTGERS REDEVELOPMENT STUDIO SPRING 2020
MARSHALL STREET SUBSTATION ALTERNATIVES ANALYSIS RUTGERS - - PowerPoint PPT Presentation
MARSHALL STREET SUBSTATION ALTERNATIVES ANALYSIS RUTGERS REDEVELOPMENT STUDIO SPRING 2020 PROJECT TEAM Teun Deuling Rebecca Weiss Matt Soslow Ryan Wolf Donna Iken MCRP, 2020 MCRP, 2020 MCRP, 2020 MCRP, 2021 MCRP, 2020 Samuel
MARSHALL STREET SUBSTATION ALTERNATIVES ANALYSIS
RUTGERS REDEVELOPMENT STUDIO SPRING 2020
Teun Deuling
MCRP, 2020
Rebecca Weiss
MCRP, 2020
Matt Soslow
MCRP, 2020
Ryan Wolf
MCRP, 2021
Donna Iken
MCRP, 2020
Samuel Rosenthal
MCRP, 2020
Bhavin Patel
MCRP / MPP, 2020
Jae-Ah Chung
MCRP, 2020
Francisco Espinoza
MCRP, 2020
§
Recap of previous presentation
§
Data collection and analysis
§
Alternatives
§
Next steps
§
The purpose of this Alternatives Analysis is to provide the City of Hoboken with a report that will:
the surrounding urban context
approach considerations of land use, design, transportation, and infrastructure
scenario
Aerial view of community and site Aerial view of site
§ Data shows that Project site resides in a low-income residential area, with a large population of elderly and young residents. § The site is serviced by a variety of transportation alternatives including the 2nd Street Light rail station, Hoboken Hop and Senior Shuttle. Ridership survey published in 2019 showed 41% of all light rail riders frequent businesses within 0.5 miles of boarding station, spending $41 million annually. § While located in a flood zone, with some degree of environmental contamination, remediation of the site will allow for the currently zoned uses to prevail (including residential and community uses). § Data reveals that Hoboken’s population has significantly increased since 2000, with a large number of families moving to the City. Despite the increase in development, the area surrounding the Project site lacks retail, and community facilities. § Primary and secondary data reveals that residents are concerned about traffic and flooding surrounding the site, and would like to see the site developed as a grocery store, entertainment center and/or indoor recreation facility.
Public Outreach
Reports Census Data Online Sources
§ An online survey was posted to the City
well as several community Facebook groups § The survey remained accessible between March 11th and April 15th 2020 and received 354 responses § The survey asked 8 questions, including:
the site
site
§ 80% of respondents reported that they resided within the southern part of Hoboken (4th Street to Observer Highway) § 28% of respondents ranked traffic congestion as the number one concern for the area surrounding the project site, followed equally by 21% reporting lack of food options, and public safety concerns as the most pressing issues § A supermarket was identified as the amenity most needed in the area (65%), followed by Retail (56%) and Park space/Entertainment (49%) § When asked what type of facility should be built on the site, 76% of respondents reported retail options, including a grocery store, and 56% reported an indoor recreation center should be built on the site
Source: SurveyMonkey
Source: SurveyMonkey
Source: SurveyMonkey
Source: SurveyMonkey
Hoboken 2018 Master Plan Reexamination January 2020 Community Meeting Hoboken Facebook and Community Pages
Source: NJ.com, Credit: Teri West/Jersey Journal
Source: Facebook
Alternative I: Housing & Retail Alternative II: Neighborhood Wellness Alternative III: Work & Play Space
33 mixed-income units 10% affordable 80 mixed-income units 10% affordable 80 mixed-income units 1/3 affordable 2 floors, 30,800 GSF 5 floors, 77,000 GSF 5 floors, 77,000 GSF Retail 13,860 RSF 3 - 5 tenants
§ Retail (Catchment Area)
grocery store)
§ Housing (Very Strong Market)
units)”
Option 1: City owns land and manages property
Option 2: City owns site, but leases land to developer
mix of uses and affordability
Option 3: City sells the land
10% Affordable Residential 10% Affordable Residential (Δ) 33% Affordable Residential (Δ) Building Area Gross Building Area Rentable Residential Rentable Retail 46,200 sf 25,000 sf 13,860 sf 92,300 sf 65,200 sf 13,860 sf Anticipated Unit Mix Studio Units (market, affordable) One-bed Units (market, affordable) Two-bed Units (market, affordable) 9 (8, 1) 16 (14, 2) 7 (6, 1) 24 (21, 3) 36 (32, 4) 20 (18, 2) 24 (16, 8) 36 (24, 12) 20 (13, 7) Development Budget (construction only) Development Budget (including land sale) $13,028,400 $13,938,113 $26,056,800 $27,207,758 $26,056,800 $26,790,877
No Δ Density Δ Sources (Construction Only) Amount Share Equity $5,385,615 $10,771,230 35% Debt $7,642,785 $16,936,920 65% Uses Amount Share Hard Costs $10,857,000 $21,714,000 83% Soft Costs $2,171,400 $4,342,800 17% Total $13,028,400 $26,056,800 100% Residual Land Value (for private developer) No Δ Density Δ Density Δ 10% Affordable 10% Affordable 33% Affordable $866,393 $1,096,150 $699,121
Studio 1 BR 2 BR 3BR Building Amenities Vine Not Available $3,000+ 700 - 850 Sq ft $3,000+ 1,000 - 1,400 Sq ft No Price Provided Outdoor Pool Fitness Center Parking Garage Ground Floor Retail The Harlow $2,700 - $3,000 525 - 615 Sq ft $3,400+ 700 - 850 Sq ft No Price Provided 1,000 - 1,340 Sq ft No Price Provided 1,317 - 1,410 Sq ft Outdoor Pool Fitness Center Parking Garage Ground Floor Retail Harrison Flats Not Available Not Available No Price Provided 1,369 Sq ft No Price Provided 1,369 Sq ft Parking Garage The Lexington Not Available $2,800-$3,000 750 - 850 Sq ft $3,300+ 1,000 - 1,175 Sq ft Not Available Parking Garage Fitness Center Fire Pit
§
No additional parking options on site
§
Site has a score of 90/100 for walkability, meaning it is easy to get around without a vehicle
§
Rely on:
§
Design Flood Elevation (DFE) is set at 13 feet with dry floodproofing for lower level
§
Site will have green infrastructure, including tree plantings, a green roof, and bioswales
First Floor Parking space Second Floor Retail Pharmacy Coffee Shop Third Floor Urgent Care Specialist Space Fourth Floor Fitness Center Classroom Space Racquetball Court Fifth Floor Swimming Pool
§ Consists of five stories at an estimated building coverage of 14,086 square feet § The gross floor area over these five stories is estimated to be 70,430 square feet Expected Variances Required for the Site
§ The entrance and exit to the site’s first floor parking garage will be located on 2nd Street § Parking garage will have an estimated maximum capacity of 30 parking spaces § Pedestrian entrances will be located on both the Marshall Street and Harrison Street sides, with the Marshall Street entrance serving as a pickup/drop-off point § Pedestrian entrances will lead straight into the second floor (pharmacy and coffee shop)
Streetscaping
Tree plantings surrounding the perimeter of the building, including a small public plaza on the North Side of the building along Marshall Street
Design Flood Elevation
Wet floodproofing of at-grade parking lot as well as a street-level stairwell to connect the second floor with pedestrians
Transportation
Thirty parking spaces to be provided, with the
Stormwater Retention
An anticipated rooftop rain garden that is accessible to the public via the building’s elevator
RESILIENT TRANSPORTATION
View of parking entrance/exit onto 2nd St Wireframe view of building facing east
Floor Two - Pharmacy
§
Provide access to prescriptions, health products as well as limited selection of grocery products
§
Downtown Hoboken has a significant portion of the city’s senior population
§
No full-service pharmacies within ½ mile radius of project site
§
76.15% of survey respondents wish to see access to groceries on the site
Floor Three - Medical Services
§ The census tract containing the project site has the highest concentration of uninsured residents in the city (10 percent) § The demographic characteristics of the project site’s surrounding community - lower income, greater proportion of elderly, lower numbers of insured - indicate a need for medical facilities § “Nearly half of all visits to urgent care centers result in an average charge of less than $150 — compared to the average cost of an ER visit at $1,354.” § One urgent care within ½ mile radius around project site - serving the highest density of elderly in Hoboken
Floor Four - Fitness Center
§ The National Recreation & Parks Association recommends the operation of one community gym per 26,418 residents (i.e. Hoboken should have two community gyms) § Help to replace some of the services lost from the former YMCA building § Enables community-centered programming
percent of Park and Recreation Agencies
and 83 percent offered fitness enhancement classes
Floor Five – Swimming Pool
§ The city’s 2018 Reexamination Report concluded that 69 percent of survey respondents agreed with the need for public indoor recreation center § The online survey revealed 57% of respondents supported indoor recreational uses (with 10 out of 55 submitted written comments referencing a pool) § According to the National Recreation & Parks Association, the median jurisdiction per community pool facility is 47,800 residents. With more than 55,000 residents and no current public pool, Hoboken does not meet this metric.
Facility Name Facility Type Year Opened Construction Cost
Cost per
Piscataway Community Center YMCA, NJ Indoor Aquatic Center, Fitness Center, Outdoor Spray Park 2020 $32,000,000 83,000 $385.54 Berkeley Heights YMCA, NJ Fitness Center, Outdoor Pool 2020 $15,016,970 (Guaranteed Maximum Price) 40,000 $375.42 New Jersey Institute of Technology Wellness and Events Center, Newark, NJ Indoor Aquatic Center, Fitness Center, Athletic Facilities, Arena 2017 $102,000,000 220,000 $463.64
Piscataway Community Center YMCA- Piscataway, NJ Berkeley Heights YMCA- Berkeley Heights, NJ NJIT Wellness and Events Center- Newark, NJ
Facility Name Facility Type Year Opened Constructio n Cost
Cost per
Suffolk County Community College (SCCC) Eastern Campus Health and Wellness Center, Riverhead, NY Indoor Aquatic Center, Fitness Center 2019 $21,000,000 40,000 $525.00 Reynoldsburg Community Center YMCA, OH Indoor Aquatic Center, Fitness Center 2020 $30,000,000 75,000 $400.00 YMCA and Yakima Rotary Aquatic Center, WA Indoor Aquatic Center, Fitness Center 2019 $22,000,000 72,000 $305.56
SCCC Eastern Campus Health and Wellness Center- Riverhead, NY Reynoldsburg Community Center YMCA- Reynoldsburg, OH YMCA and Yakima Rotary Aquatic Center- Yakima, WA
City 2013 Cost Per Sq. Ft. 2020 Cost Per Sq. Ft. New York City, NY $314.65 $352.68 Boston, MA $282.55 $316.70 Philadelphia, PA $271.22 $304.00
Source: RSMeans data, 2013
Use Construction Cost Estimate per Sq. Ft. Square Footage Construction Cost Estimate 1st Floor- Parking $64.77 13,100 $848,487.00 2nd Floor- Pharmacy $227.04 10,088 $2,290,379.52 2nd Floor- Coffee Shop $227.04 1,620 $367,804.80 3rd Floor- Medical Space $282.00 9,500 $2,679,000.00 4th Floor- Fitness Center $210.00 7,670 $1,610,700.00 4th Floor- Multi-purpose Classroom $150.00 4,340 $651,000.00 4th Floor- Racquetball Court $268.57 800 $214,856.00 5th Floor- Swimming Pool and Supporting Space $352.68 12,600 $4,443,768.00 Total Remaining Space (Lobbies, HVAC, elevator, storage, etc.) $150.00 11,582 $1,737,300.00 TOTAL $14,843,295.32
§
Revenues: operations surplus from previous years, membership, concessions, shared service agreements
§
Expenditures: wages (typically 50- 60% of costs), utilities, debt, capital
§
Community pools average a 50-75% cost recovery, depending on the season and amenities (waterpark, etc.)
§
Reasons to contract out include- limit liability, subsidies and day-to-day
limited municipal staff expertise, or to have buy-in from local community
Source: Photo by Raphaël Biscaldi on Unsplash
PLAY & WORKSPACE
View Facing Harrison St.
§ More young families are moving to Hoboken
2000 and 2015 § Few comparable attractions in the area § Potential partners already exist within the City
attending between 2011 and 2017, and is looking to expand into Education & Research Center
“pop-up” branches
Board of Education for K-12 STEM programming § Great opportunity to provide informal educational programming for Hoboken’s youth
Stepping Stones Museum - Norwalk, CT
■
Museum would likely be run as a 501(c)3 non- profit
■
Construction costs for children’s museums in urban settings range from $477 to $673 per sq. ft.
■
A 28,000 sq. ft. museum would cost between $13.4 million and $18.8 million, with an average of approximately $16.1 million
Please Touch Museum - Philadelphia, PA
Expenses
maintenance
maintenance
Revenue Additional Support
donations Earned Income
Strong Museum of Play - Rochester, NY
Children’s Museum of Indianapolis - Revenues and Expenses (FY 2018)
Minnesota Children’s Museum - Revenues and Expenses (FY 2019)
§ 6.4% of the Hoboken citizens are seniors over 65 ○ 37.3% of them have disabilities
Existing Services in Hoboken ○ Hoboken University medical Center TCU ○ Senior Center at the Hoboken Multi Service Center ○ In-home health care service providers ○ Nutrition Programs ○ Free transportation services for seniors
Medical, Nursing, Coordinating, etc.
Revenue Sources § Operating Revenue § Grant Opportunities
Jersey (Robert Wood Johnson Foundation)
Council on Humanities)
Action Acceleration (Robert Wood Johnson Foundation's New Jersey Health Initiatives)
Foundation)
Organizations in New Jersey and Pennsylvania (Provident Bank Foundation)
Expenses
Providers (Registered Nurse Supervisors, Social Workers, Dietitian)
Providence Health Care Inc. - Projected Revenues and Expenses (Lynch, 2018)
Professional Care
§ Alzheimer Programs
§ Physical, Occupational, Speech Therapy § Coordination of health services, medical appointments, and treatments
Daily Activities
§ Hot Meals
§ Entertainment § Exercise
Community Support
§
Caregiver Education
§
Caregiver Counseling
Per Hoboken’s 2018 Plan Reexamination Report:
incubators and accelerators throughout the city. Stevens’ has multiple programs that grant students the opportunity to learn about entrepreneurship and innovation. Yet, according to NJ Tech Council, Hoboken still lacks an innovation center that specifically targets technology innovation even with Stevens’ there.
New Jersey has two generous Tax credits:
Rent Initiative (ICWRI)
(R&D) tax credit, to support new and established high-tech companies in growing the Garden State’s Innovation Economy Other Options: Venture Capital, Non-Profit, Private Investment, or Lease Examples: NYC EDC - Utilizes Tax incentives from the state and City of New York to fund multiple square feet of incubation space throughout the City Texas Tech University- has recently invested in a 40,000 sq ft incubation space for he University at $2 million dollars. It is part of their over $1 billion dollar investment. It has also partnered with other Universities nearby.
§
Ground floor is flood proof
§
12 feet elevation
§
Green roof
§
Open Space
Alternative I: Mixed use Housing/Retail Alternative II: Neighborhood Wellness Alternative III: Work/Play Residential Yes No No Retail Yes Yes No Office Space No Yes Yes Open Space No No Yes Recreational No Yes Yes Parking No Yes Yes
Alternative I Alternative II Alternative III Height (Floor) 64 feet (6 stories) 80 feet (5 stories) 64 feet (6 stories) Coverage 15,360 sf 14,086 sf 13,500 sf Gross Area 92,160 sf 70,430 sf 69,500 sf Landscaping
southwest corner
benches
species, bioswales, benches, and streetlights Ground Floor Use Retail Indoor parking space Indoor Parking, senior center entrance, and first floor of children’s museum Sense of Place Strengthen the characteristic of a highly residential neighborhood, while providing viability through generating pedestrian population with retail destination. Make the place a destination of Hoboken by providing health and wellness services that all Hoboken citizens can rely on. Provide a beautiful streetscape through creating a green open space. Give a sense of a safe place for the vulnerable population (seniors and children) which expands to a sense of a safe neighborhood.
CRITERION ANALYSIS
A.
Substandard, Unsafe, Unsanitary, Dilapidated, or Obsolescent Buildings Several buildings are erected at the site and serve to transmit and distribute power throughout the electric grid. The buildings on-site are not deteriorated and have not fallen into a state of disrepair as the substation is currently in operation. Conclusion: The “A” criterion does NOT apply.
B.
Abandoned Commercial and Industrial Buildings The buildings are neither vacant nor abandoned as the substation is currently in operation. Conclusion: The “B” criterion does NOT apply.
C.
Publicly-owned or Unimproved Vacant Land Currently, the site is neither publicly owned nor unimproved vacant land. Conclusion: The “C” criterion does NOT apply.
D.
Obsolete Layout and Faulty Arrangement or Design The site contains a land use, an electrical substation, that in its current layout and design has an adverse impact on the surrounding, mostly residential, area. Most importantly, it is necessary to raise the elevation of the substation to prevent electrical outages caused by flooding
the existing spatial constraints of the site. Therefore, due to an obsolete layout of the site, the substation is a land use that has an adverse impact on the community’s safety, health, morals, and welfare. Conclusion: The “D” criterion DOES apply.
E.
Property Ownership and Title Issues No circumstances related to the ownership or configuration of property have created a stagnant and unproductive condition of the site. Conclusion: The “E” criterion does NOT apply.
F.
Fire and Natural Disasters The site is not larger than 5 contiguous acres and has not been destroyed fire or natural disaster. Conclusion: The “F” criterion does NOT apply.
G.
Urban Enterprise Zones (UEZ) The site is not designated as a UEZ by the New Jersey Urban Enterprise Zone Authority. Conclusion: the “G” criterion does NOT apply.
H.
Smart Growth Consistency The designation of the area is consistent with smart growth planning principles adopted pursuant to law or regulation. The area’s proximity to public transit makes it ideal for the promotion of smart growth principles that encourage compact building design, creating a range of housing options, and supporting a walkable area. Conclusion: The “H” criterion DOES apply.
Alternative I Alternative II Alternative III On-site Parking No Yes Yes Number of Spaces
23 Location of Parking
garage Ground-level garage accessed via Marshall Street Parking Square Footage
7,500
§ Alternative I relies on the adjacent Sylvan Sky Garage and proposes short-term parking spaces in the Marshall Street loop § All three alternatives minimize on-site parking by leveraging Hoboken’s transit options and high level of walkability
Access Points Comparison
Alternative I Alternative II Alternative III Design Flood Elevation Yes (13 feet) Yes (13 feet) Yes (13 feet) Dry Floodproofing Yes No No Wet Floodproofing No Yes (Parking - at grade) Yes (Parking - at grade) Streetscaping Yes Yes Yes Stormwater Retention Yes Yes Yes Need Sewer Connection? Yes Yes Yes
§ Mixed-income affordable and market rate housing, combined with ground-floor retail would satisfy the
need for affordable units in Hoboken
§ Retail options, such as a grocery store, coffee shop, and pharmacy, would all suit the current needs of
the neighborhood given the lack of retail and food stores in the area
§ An indoor recreation center featuring a children’s museum, gym, and/or swimming pool would
address the need for more community assets in the City
§ A senior center would address the need for space for Hoboken’s aging population, especially older
residents who reside in the Hoboken Housing Authority
§ Flexible office space would reflect the demand for more office space for the City’s non-profit
§ Each alternative relies on the current transportation infrastructure, and minimizes the need for
parking
§ The design for each alternative adheres to Hoboken’s resilient design guidelines
Complete remediation of project site by PSE&G Conduct a study to ascertain feasibility of ANR designation Create a pop-up park in the interim after the site has been remediated Conduct public outreach with hard to reach populations to determine potential uses Market studies to determine demand for retail and housing Determine appropriate development partners Inventory analysis of development pipeline