
SLIDE 1
12/24/2014 1
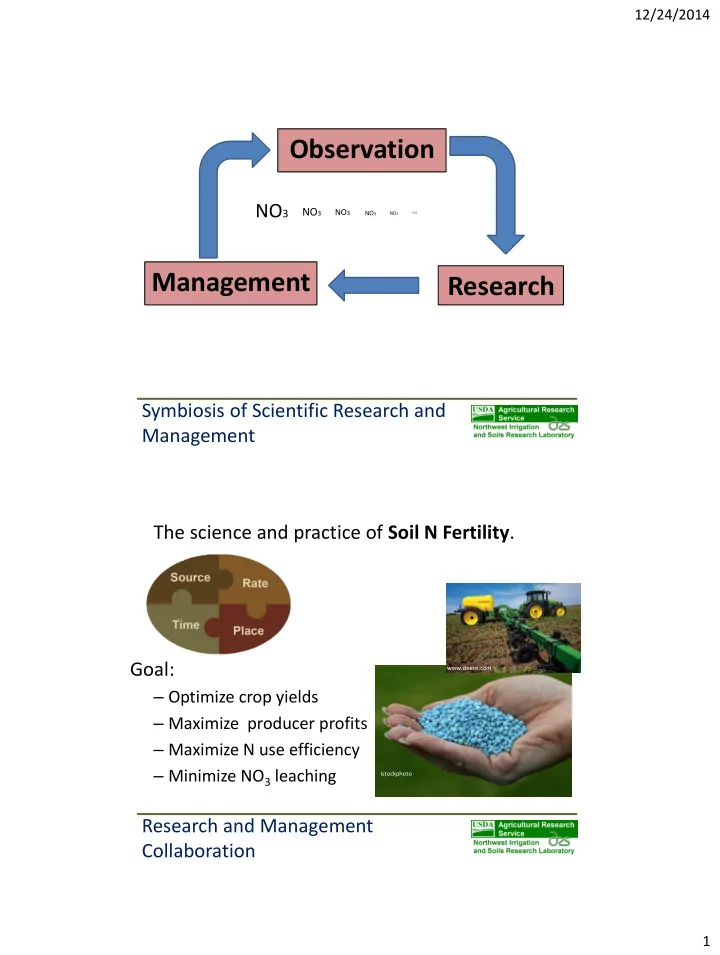
Symbiosis of Scientific Research and Management
Observation Research Management
NO3
NO3
NO3
NO3
NO3
NO3The science and practice of Soil N Fertility. Research and Management Collaboration
www.deere.com istockphoto
Management Research Symbiosis of Scientific Research and - - PDF document
12/24/2014 Observation NO 3 NO 3 NO 3 NO 3 NO 3 NO3 Management Research Symbiosis of Scientific Research and Management The science and practice of Soil N Fertility . Goal: www.deere.com Optimize crop yields Maximize producer
NO3
NO3
NO3
NO3
NO3www.deere.com istockphoto
Year 1980 1985 1990 1995 2000 2005 2010 Average Sucrose yield (lbs/acre) 1000 2000 3000 4000 5000 6000 7000 8000 9000 10000 Total Available N (lbs N/acre) 20 40 60 80 100 120 140 160 Sucrose Total Available N
Sugarbeets – North Central US Corn – Nebraska
1955 1960 1965 1970 1975 1980 1985 1990 1995 2000 2005 Grain Yield (bu acre-1)
20 40 60 80 100 120 140 160 180
Fertilizer N Rate (lb acre-1)
20 40 60 80 100 120 140 160
atlas-geo.com crops.org mississippi-crops.com
N Mineralization
N Mineralization
Inorganic N Supply (Fertilizer N + Inorganic Soil N) (lbs N/acre)
50 100 150 200 250 300 350 Total Plant N Uptake (lbs N/acre) 50 100 150 200 250 300 350 50 100 150 200 250 300 350 400 450 Total Plant N Uptake (lbs N/acre) 50 100 150 200 250 300 350 400 450 2008 2010 118 117 29
13 site years 113 site years
Corn Acres Harvested (x1000)
1 9 8 1 9 8 5 1 9 9 1 9 9 5 2 2 5 2 1 2 1 5 20 40 60 80 100 120 140 160 100 200 300 400 500
Silage Acres Grain Acres Dairy Cow Population
Dairy Cow Population (x1000)
South Central Corn and Dairy Cow Data (NASS)
Site Kimberly, ID Soil Portneuf silt loam Year 2014 Soil Test N, 0-24 in 45 ppm Inland Pacific Northwest Grain Fertilizer Recs 120-130 lbs N/acre Inland Pacific Northwest Silage Fertilizer Recs 90 lbs N/acre
N Rate Main Effect P = 0.8579 NS N Fertilizer Rate (lbs N/acre) 50 100 150 200 250 300 350 Grain Yield (bu/acre) 120 130 140 150 160 170 180 190 200 210 220 N Supply, N Fertilizer + Soil Inorganic N (lbs N/acre) 200 250 300 350 400 450 500 550 Grain Yield versus N Rate and Supply Mean Yield N Rate Main Effect P = 0.6051 NS N Fertilizer Rate (lbs N/acre) 50 100 150 200 250 300 350 Silage Yield (tons/acre @ 65% Water Content) 16 18 20 22 24 26 28 30 32 34 N Supply, N Fertilizer + Soil Inorganic N (lbs N/acre) 200 250 300 350 400 450 500 550 Silage Yield versus N Rate and Supply Mean Yield
N Supply, N Fertilizer + Soil Inorganic N (lbs N/acre) 50 100 150 200 250 300 350 400 ERS (lbs/acre) 6000 7000 8000 9000 10000 11000 2008 - Sig. N Response. EONS = 190 lbs N/acre 2010 - Sig. N Response. EONS = 215 lbs N/acre 2014 - No Sig. N response
5 foot Irrigation shovel
S i t e 1 S i t e 2 S i t e 3 S i t e 4 Percent of Total Inorganic N Relative to 0-3 ft 20 40 60 80 100 120 3-4 ft 0-2 ft
Manure Every Other Year Manure Every Year NO3-N + NH4-N in 0-2 ft (lbs N/acre) 100 200 300 400 500
Manure Every Other Year Manure Every Year NO3-N + NH4-N in 0-2 ft (lbs N/acre) 100 200 300 400 500