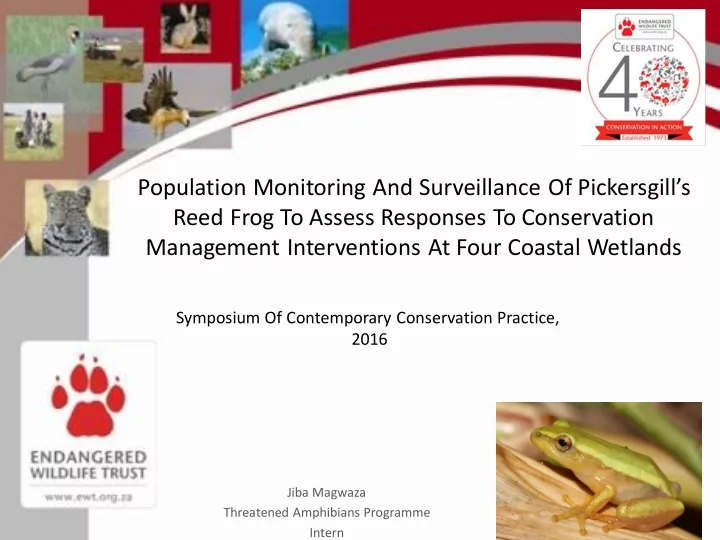

Population Monitoring And Surveillance Of Pickersgill’s Reed Frog To Assess Responses To Conservation Management Interventions At Four Coastal Wetlands Symposium Of Contemporary Conservation Practice, 2016 Jiba Magwaza Threatened Amphibians Programme Intern
Introduction Amphibians are currently the most threatened class of vertebrate on earth Frogs are important: • Food chain • Bio-indicators • Flagships for freshwater
Pickersgill’s Reed Frog (Hyperolius pickersgilli) Background • Critically Endangered • BMP-S (October) • Endemic to KZN • Monitoring
Distribution Map 25 PRF sites across Kwa Zulu-Natal coast (as of Feb 2016) 2 PRF sites in protected areas
Monitoring-Song Meters National Resource Management Project • Mt Moreland • Widenham • Isipingo • Adams Mission • Benchmark - Simbithi
Monitoring- Song Meters
Monitoring-Song Meters Simbithi Eco Estate: Benchmark site
Monitoring-Song Meters Simbithi Eco Estate: Benchmark site
Wetland Assessment Mt Moreland:
Wetland Assessment Froggy Pond wetland in Mount Moreland; Froggy Pond is a 7.78ha reed marsh Mt Moreland:
Wetland Assessment Mt Moreland: Disturbance units with impact ratings for flow distribution and retention.
Wetland Assessment Mt Moreland: Disturbance units with impact ratings for vegetation
Wetland Assessment Mt Moreland: Methods
Wetland Assessment Mt Moreland Activities / Land Uses that Reduce Water Inputs Extent (Ha) Extent of Catchment (%) Sugarcane (Active) 1.08 0.33% Irrigated lands 0 0% Alien vegetation 85.95 26.22% Plantations 0 0% Dams 0 0% Activities / Land Uses that Increase Water Inputs Volume (m3) Extent of Catchment MAR (%) Waste water overflows Not available Assumed to be 5% of natural inputs Leaking water and/or sewer infrastructure Not available Assumed to be 1% of natural inputs Mount Moreland septic tanks Not available Assumed to be 4% of natural inputs Hardened surfaces 84.23 Assumed to be 5% of natural inputs Activities / Land Uses that Increase Flood Peaks Extent (Ha) Extent of Catchment (%) Hardened surfaces 84.23 25.69% (assumed 50% attenuation by KSIA detention dam) Bare surfaces & Poor veld (recently abandoned cane land) 133.47 40.71%
Social Engagement School Surveys
Social Engagements NRM Team Attitude Surveys
Way forward Stewardship And Community Agreements Monitoring Awareness
Acknowledgements • Pictures: Ryan Edwards, Nick Evans, Cherise Acker, Jeanne Tarrant. • Sponsors and Partners:
Questions? Thank you
Recommend
More recommend