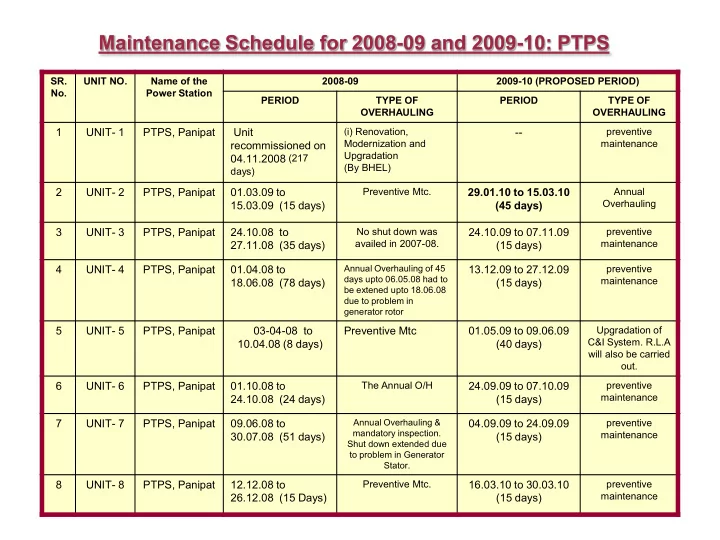

Maintenance Schedule for 2008-09 and 2009-10: PTPS
SR. No. UNIT NO. Name of the Power Station 2008-09 2009-10 (PROPOSED PERIOD) PERIOD TYPE OF OVERHAULING PERIOD TYPE OF OVERHAULING
1 UNIT- 1 PTPS, Panipat Unit recommissioned on 04.11.2008 (217
days)
(i) Renovation,
Modernization and Upgradation (By BHEL)
- preventive
maintenance
2 UNIT- 2 PTPS, Panipat 01.03.09 to 15.03.09 (15 days)
Preventive Mtc.
29.01.10 to 15.03.10 (45 days)
Annual Overhauling
3 UNIT- 3 PTPS, Panipat 24.10.08 to 27.11.08 (35 days)
No shut down was availed in 2007-08.
24.10.09 to 07.11.09 (15 days)
preventive maintenance
4 UNIT- 4 PTPS, Panipat 01.04.08 to 18.06.08 (78 days)
Annual Overhauling of 45 days upto 06.05.08 had to be extened upto 18.06.08 due to problem in generator rotor
13.12.09 to 27.12.09 (15 days)
preventive maintenance
5 UNIT- 5 PTPS, Panipat 03-04-08 to 10.04.08 (8 days) Preventive Mtc 01.05.09 to 09.06.09 (40 days)
Upgradation of C&I System. R.L.A will also be carried
- ut.
6 UNIT- 6 PTPS, Panipat 01.10.08 to 24.10.08 (24 days)
The Annual O/H
24.09.09 to 07.10.09 (15 days)
preventive maintenance
7 UNIT- 7 PTPS, Panipat 09.06.08 to 30.07.08 (51 days)
Annual Overhauling & mandatory inspection. Shut down extended due to problem in Generator Stator.
04.09.09 to 24.09.09 (15 days)
preventive maintenance
8 UNIT- 8 PTPS, Panipat 12.12.08 to 26.12.08 (15 Days)
Preventive Mtc.
16.03.10 to 30.03.10 (15 days)
preventive maintenance