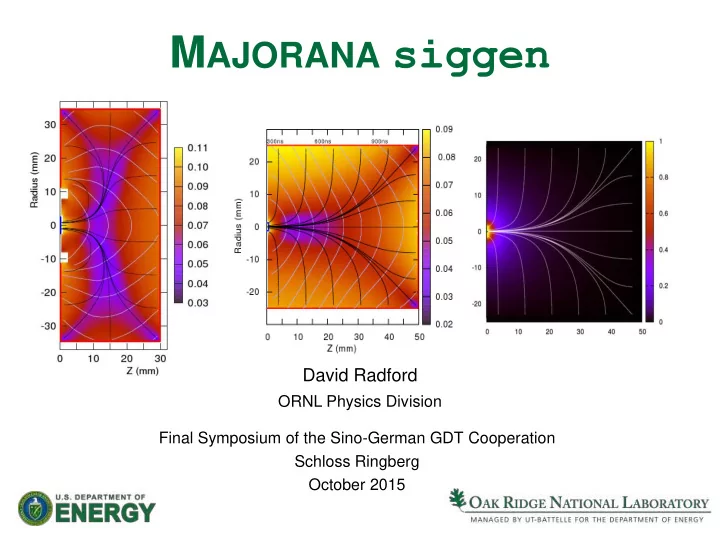
M AJORANA siggen David Radford ORNL Physics Division Final - - PowerPoint PPT Presentation

m ajorana siggen
SMART_READER_LITE
LIVE PREVIEW

M AJORANA siggen David Radford ORNL Physics Division Final - - PowerPoint PPT Presentation

M AJORANA siggen David Radford ORNL Physics Division Final Symposium of the Sino-German GDT Cooperation Schloss Ringberg October 2015 Outline Overview of fieldgen and siggen New capabilities Capacitance Charge cloud sizes


slide-1
SLIDE 1

MAJORANA siggen

Final Symposium of the Sino-German GDT Cooperation Schloss Ringberg October 2015

David Radford

ORNL Physics Division

slide-2
SLIDE 2

2 Managed by UT-Battelle for the U.S. Department of Energy

  • Overview of fieldgen and siggen
  • New capabilities
  • Capacitance
  • Charge cloud sizes
  • Mobilities
  • Li transition layer

Outline

slide-3
SLIDE 3

3 Managed by UT-Battelle for the U.S. Department of Energy

For CANBERRA (BEGe) and ORTEC PC detectors

  • Require cylindrical symmetry in detector geometry
  • Both programs use a common 2D grid (r, z) for field and weighting

potentials

Recent major updates

  • One common configuration / geometry file for fieldgen, siggen
  • Include effects of charge cloud size, diffusion, and repulsion on

the signal shapes

  • Code reorganization for easier multi-threading

Code is open source, freely available: svn://radware.phy.ornl.gov/MJ/mjd_siggen

MJD_fieldgen and MJD_siggen

slide-4
SLIDE 4

4 Managed by UT-Battelle for the U.S. Department of Energy

Config file

  • Detector geometry
  • Impurity profile
  • Grid size
  • Temperature
  • File names
  • Charge cloud
  • ptions

MJD_fieldgen and MJD_siggen

fieldgen siggen (stester)

Electric potential Weighting potential(s) Signals Input interaction locations (energies) GEANT

slide-5
SLIDE 5

5 Managed by UT-Battelle for the U.S. Department of Energy

Calculation of electric and weighting potentials

  • Stand-alone program
  • 2D relaxation, using cylindrical symmetry
  • Simplest boundary condition for passivated surface; parallel field
  • Does not try to include material outside the crystal
  • Automatic adaptive grid (coarse -> finer -> finest) to speed up

calculation

  • Typically use 0.1 mm grid for MJD PPCs
  • Attempts to deal with partially filled voxels
  • Properly handles undepleted volumes
  • Iteratively finds undepleted voxels and sets their space charge to

zero

  • Calculates capacitance of readout contacts

MJD_fieldgen

slide-6
SLIDE 6

6 Managed by UT-Battelle for the U.S. Department of Energy

Depletion

  • Should always use measured/calculated depletion voltages to validate
  • r adjust the impurity concentration in the config file
  • Good and bad PPCs; 100V per step

Head Tail Tail Head

slide-7
SLIDE 7

7 Managed by UT-Battelle for the U.S. Department of Energy

Depletion

  • Segmented inverted-coaxial point-contact detector
slide-8
SLIDE 8

8 Managed by UT-Battelle for the U.S. Department of Energy

MJD_fieldgen calculation of capacitance vs. voltage

  • Calculation (static) always higher than measurement (dynamic)

ORTEC PPC PONaMa-1

Capacitance Curves

Measured Different impurity profiles

slide-9
SLIDE 9

9 Managed by UT-Battelle for the U.S. Department of Energy

MJD_fieldgen calculation of capacitance vs. voltage

Capacitance Curves

slide-10
SLIDE 10

10 Managed by UT-Battelle for the U.S. Department of Energy

Calculation of signals

  • Mobilities
  • Temperature dependence
  • Crystal orientation
  • Charge cloud size, diffusion, repulsion

Intended for use as a library

  • Easy to calculate sums of MSE signals from GEANT, for example
  • Example codes and simple interactive test program provided

MJD_siggen

slide-11
SLIDE 11

11 Managed by UT-Battelle for the U.S. Department of Energy

Drift velocity, Weighting potential paths, times

Fields and Mobilities for a generic PPC

slide-12
SLIDE 12

12 Managed by UT-Battelle for the U.S. Department of Energy

Signals Calculated Near and Above Depletion

800 to 900 V in steps of 20 V 100 to 900 V in steps of 100 V

slide-13
SLIDE 13

13 Managed by UT-Battelle for the U.S. Department of Energy

Signals Calculated with Pinch-Off

Time, 10 ns / sample

slide-14
SLIDE 14

14 Managed by UT-Battelle for the U.S. Department of Energy

BEGe Event + Signal Simulations

Alex Hegai, Susanne Mertens

Measurement Simulation, CCS 0.5 mm

A/E for a BEGe Collimated 511-keV beam

Counts

slide-15
SLIDE 15

15 Managed by UT-Battelle for the U.S. Department of Energy

BEGe Event + Signal Simulations

Alex Hegai, Susanne Mertens

Measurement Simulation, CCS 0.5 mm

A/E for a BEGe Collimated 511-keV beam

slide-16
SLIDE 16

16 Managed by UT-Battelle for the U.S. Department of Energy

ORTEC Event + Signal Simulations

Alex Hegai, Susanne Mertens

Measurement Simulation, CCS 0.5 mm

A/E for an ORTEC PPC Collimated 511-keV beam

slide-17
SLIDE 17

17 Managed by UT-Battelle for the U.S. Department of Energy

ORTEC Event + Signal Simulations

Alex Hegai, Susanne Mertens

A/E without CCS

A/E vs. Drift Time for PONaMa-II Collimated 511-keV beam

Measurement Simulation, CCS 1.0 mm

slide-18
SLIDE 18

18 Managed by UT-Battelle for the U.S. Department of Energy

Drift Time: Azimuthal Scan

  • Collimated Am source scanned around the circumference of Seg NPC
  • Five minutes per point, highly reproducible (~ 1 ns)
  • Determine crystal axis to ~ 0.5 degrees
  • Good fit requires adjusting both the electron mobilities (from literature)

and directional asymmetry

slide-19
SLIDE 19

19 Managed by UT-Battelle for the U.S. Department of Energy

Slow Signals from the Li Transition Layer

Paddy Finnerty, Graham Giovanetti

Not part of standard siggen

  • Developed physical model of the Li “dead layer” and “transition layer”
  • “Recombination zone” close to the surface
  • “Diffusion zone” from there to the bulk

Surface Recombination Diffusion Collection

slide-20
SLIDE 20

20 Managed by UT-Battelle for the U.S. Department of Energy

Slow Signals from the Li Transition Layer

  • Convolute diffusion result with normal siggen output

to get degraded signal shape

Bulk Li contact

  • Slow and small

Time Charge

Paddy Finnerty, Graham Giovanetti

slide-21
SLIDE 21

21 Managed by UT-Battelle for the U.S. Department of Energy

Detectors without Cylindrical Symmetry

3D calculations are much slower in fieldgen

  • Generally requires a coarser grid
  • e.g. GRETINA: (1mm)3 rather than (0.1mm)3 for PPCs

Examples:

  • GRETINA detectors (hexagonal taper, azimuthal segmentation)
  • Segmented PC detectors (WP of azimuthal segments)
  • In this case, can use the same (r,z) grid as other potentials,

and add grid in φ for azimuthal segments only

slide-22
SLIDE 22

22 Managed by UT-Battelle for the U.S. Department of Energy

  • Programs for field and signal calculation are open source
  • Incorporated into MAGe
  • Fast and easy to use
  • Include effects such as pinch-off, charge cloud size and diffusion, …
  • Results generally agree well with measurements

Summary

Acknowledgements

Many, but especially

  • I-Yang Lee (LBNL)
  • Karin Lagergren, Ren Cooper (ORNL)
  • Alex Hegai, Susanne Mertens, Paddy Finnerty, Graham Giovanetti