
SLIDE 1
Lower Main St. Crossing of James Creek Design Team Project - - PowerPoint PPT Presentation
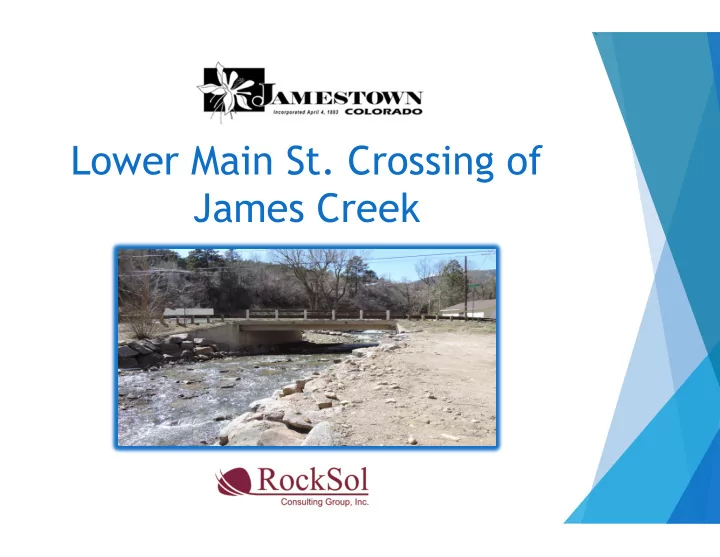
Lower Main St. Crossing of James Creek Design Team Project Principal Miranda Lange, P.E. Project Manager Dan Tuttle, P.E. Structural Engineer Steven Lykens, P.E. Geotechnical Engineer Ryan Lepro, P.G. Roadway Design Dan
Project Principal – Miranda Lange, P.E. Project Manager – Dan Tuttle, P.E. Structural Engineer – Steven Lykens, P.E. Geotechnical Engineer – Ryan Lepro, P.G. Roadway Design – Dan Tuttle, P.E. Lead Hydraulics – Anthony Alvarado, P.E. Hydraulics Engineer– James Hitchman, P.E.
BCA Analysis – Steve Pardue
After the 2013 floods, the Town applied for and received a FEMA Hazard Mitigation Program Grant (HMGP) to analyze the Lower Main St. crossing of James Creek. After the proposal and interview process, our team was awarded this project in late May 2016. The main objective of this project, is to: Increase the capacity of the creek crossing to pass the 100-year storm event to reduce the risk of similar damage in a future flood. The major scope items that our team has been tasked with includes (but is not limited to):
u Topographic Survey u Hydrology/hydraulic analysis for existing and proposed conditions u Geotechnical investigations and reporting u Develop alternatives for proposed improvements u Benefit Cost Analysis (BCA) u 60% design plans, specifications, and estimate
May
Awarded Project Finalizing Contract & Subcontracts
June
Data Collection (LOMR data, utilities, Hydrology & Hydraulic Analysis of Existing Conditions
July
Hydraulic Analysis for existing conditions continued Field Survey Done & Received Topographic Survey
August September October
Public Involvement & Town Board Presentation
Begin preliminary design for 3 alternatives
Hydraulics for existing conditions complete; begin analyzing proposed conditions.
Geotechnical Bores Done (Bedrock ~23’ Deep) BCA Analysis Direction from Town Board for selected design alternative Begin 60% design upon receiving Town Board Approval
Definition(s):
the bottom of the bridge. Freeboard is important because it correlates with the ability to pass floating debris. If we can pass floating debris, there is a high likelihood that the bridge does not get plugged and then flanked.
bridge with NO debris.
bridge with debris. Hydraulics & Hydrology:
practice, 2 or more feet of freeboard is used as a target during design.
Made the cut
Option 1 - Remove and Replace Bridge Option 2 - Raise Existing Bridge Deck Option 3 - Additional Span
Discarded
Remove and Relocate Bridge Downstream - VCUP issues at Elysian Park
and private property impacts
Fuse Plug - Difficult to design for the unknown & didn’t solve problem. Widen and Raise Existing Bridge – High cost and difficult to design with
no as-built plans. Do nothing
Existing Bridge
No construction needed. No construction impact to private property. PROS CONS Does not pass 100-year flow. Shallow spread footings that are vulnerable to failure during a 50 & 100-year storm. Old bridge built in 80s with approximately 20 years left on its lifespan (assuming properly maintained).
FREEBOARD DURING 100-YEAR EVENT
Estimated Cost: Future maintenance costs needed includes: deck rehab, spalling, future storm damage,etc. Freeboard Per Storm Event: 100-Year = 0 FT 50-Year = 0 FT 10-Year = 2.4’
FREEBOARD WATER SURFACE ELEVATION ~23’ to bedrock Approximate level of debris
Bridge Location Fire Station Breakout Flow (This is independent of bridge, and will happen in all scenarios) Breakout flow down Lower Main (Approximately 200 cfs) Breakout Flow (This is independent of bridge, and will happen in all scenarios) James Creek Flow (cfs) 500-year event = 4834 100-year event = 2777 50-year event = 2095 25-year event = 1502 10-year event = 912
Bridge Location Fire Station Breakout Flow (This is independent of bridge, and will happen in all scenarios) Breakout flow down Lower Main Breakout Flow (This is independent of bridge, and will happen in all scenarios) James Creek Flow (cfs) 500-year event = 4834 100-year event = 2777 50-year event = 2095 25-year event = 1502 10-year event = 912
Bridge Location Fire Station Breakout Flow (This is independent of bridge, and will happen in all scenarios) Breakout flow down Lower Main James Creek Flow (cfs) 500-year event = 4834 100-year event = 2777 50-year event = 2095 25-year event = 1502 10-year event = 912
Passes 100-year, clear flow Passes 100-year, debris flow Design life of new bridge would be 75 years. Constructible under current grant, except for the demolition costs. PROS
CONS Increases driveway slopes & requires moderate channel excavation. Requires a small amount of property acquisition or permanent easements. Highest construction cost, but still eligible under the current grant.
FREEBOARD DURING 100-YEAR EVENT
Estimated Construction Cost: $1,033,443* (includes 30% Contingency)
*Cost does not include: Final design, Town administration costs, construction management sts, property or easement acquisition.
Freeboard Per Storm Event: 100-Year = 2.2 FT 50-Year = 2.9 FT 10-Year = 5.0’
FREEBOARD WATER SURFACE ELEVATION ~23’ to bedrock Approximate level of debris
Bridge Location Fire Station Breakout Flow (This is independent of bridge, and will happen in all scenarios) Breakout flow down Lower Main St. eliminated Breakout Flow (This is independent of bridge, and will happen in all scenarios) James Creek Flow (cfs) 500-year event = 4834 100-year event = 2777 50-year event = 2095 25-year event = 1502 10-year event = 912
Bridge Location Fire Station Breakout Flow (This is independent of bridge, and will happen in all scenarios) Breakout flow down Lower Main St. eliminated Breakout Flow (This is independent of bridge, and will happen in all scenarios) James Creek Flow (cfs) 500-year event = 4834 100-year event = 2777 50-year event = 2095 25-year event = 1502 10-year event = 912
Passes 25 & 50-year, clear flow. Passes 25-year, debris flow. Minimal channel grading. PROS CONS Does not pass 100-year, clear flow. Does not pass 100-year, debris flow. Unlikely to pass 50-year debris flow. Requires retrofitting deep foundations. Increases driveway slopes. Requires a small amount of property acquisition or permanent easements.
FREEBOARD DURING 100-YEAR EVENT
Estimated Construction Cost: $663,287* (includes 30% Contingency)
*Cost does not include: Final Design, Town administration costs, construction management costs.
Freeboard Per Storm Event: 100-Year = 0 FT 50-Year = 0.5 FT 10-Year = 3.6’
WATER SURFACE ELEVATION ~23’ to bedrock Existing Footer Retrofitted foundations FREEBOARD Approximate level of debris
Bridge Location Fire Station Breakout Flow (This is independent of bridge, and will happen in all scenarios) Breakout flow down Lower Main Breakout Flow (This is independent of bridge, and will happen in all scenarios) James Creek Flow (cfs) 500-year event = 4834 100-year event = 2777 50-year event = 2095 25-year event = 1502 10-year event = 912
Bridge Location Fire Station Breakout Flow (This is independent of bridge, and will happen in all scenarios) Breakout flow down Lower Main Breakout Flow (This is independent of bridge, and will happen in all scenarios) James Creek Flow (cfs) 500-year event = 4834 100-year event = 2777 50-year event = 2095 25-year event = 1502 10-year event = 912
Passes 100-year, clear flow. Constructible under current grant. PROS CONS Does not pass 100 or 50-year flow, debris flow. Creates a center pier that may catch debris. Requires retrofitting deep foundations. Increases driveway slopes & requires significant channel excavation. Requires property acquisition or permanent easements.
FREEBOARD DURING 100-YEAR EVENT
Freeboard Per Storm Event: 100-Year = 0.7 FT 50-Year = 1.5 FT 10-Year = 3.2’ Estimated Construction Cost: $906,737* (w/30% Contingency)
*Cost does not include: Final Design, Town administration costs, construction management costs, property or easement acquisitions.
FREEBOARD WATER SURFACE ELEVATION ~23’ to bedrock Existing Footer Approximate level of debris
Bridge Location Fire Station Breakout Flow (This is independent of bridge, and will happen in all scenarios) Breakout flow down Lower Main eliminated Breakout Flow (This is independent of bridge, and will happen in all scenarios) James Creek Flow (cfs) 500-year event = 4834 100-year event = 2777 50-year event = 2095 25-year event = 1502 10-year event = 912
Bridge Location Fire Station Breakout Flow (This is independent of bridge, and will happen in all scenarios) Breakout flow down Lower Main eliminated Breakout Flow (This is independent of bridge, and will happen in all scenarios) James Creek Flow (cfs) 500-year event = 4834 100-year event = 2777 50-year event = 2095 25-year event = 1502 10-year event = 912
DO NOTHING – EXISTING BRIDGE
u Does not help to address the problem (Existing Bridge does not pass the 100-year
storm and has shallow foundations that are vulnerable to scour during a 50 or 100-year event.
u No upfront cost, but will require maintenance & inspection costs in the near future.
OPTION 1 – NEW BRIDGE
u Helps to address the problem (Passes 100 –Year Flow & Provides Required Freeboard). u Construction Cost = $1,033,442 (FEMA grant money does not cover $$ for demolition).
OPTION 2 – RAISE EXISTING BRIDGE
u Does not help to address the problem (Does not pass clear flow and does not provide
enough freeboard to allow floating debris to pass).
u Construction Cost = $663,287 (Feasible to construct under FEMA grant program ).
OPTION 3 – ADDITIONAL SPAN
u Does not help to address the problem (Does not provide enough freeboard to allow
floating debris to pass and center pier creates catchment point for debris).
u Construction Cost = $906,737 (Feasible to construct under FEMA grant program).
In order to obtain FEMA Phase 2 funding for this project, we must justify our
proposed alternative & cost through a Benefit Cost Analysis (BCA).
The following items are just a few of the costs evaluated in the BCA:
u Loss of life u Injuries u Property Damage u Damage to public infrastructure u Cost of future maintenance
Each of these items have an assigned dollar amount that is used to determine
whether or not the benefits of the new improvements outweigh the cost of the bridge alternative.
After fully investigating and analyzing the existing conditions and potential
alternatives, the RockSol team recommends that the Town pursue Option 1 – New Bridge.
While the other options do provide some benefits, only this option attempts to
fully address the problem, which is to: Increase the capacity of the creek crossing to pass the 100-year storm event to reduce the risk of similar damage in a future flood.
Town Board direction on preferred alternative – October 3, 2016 Prepare 60% design plans, specification, and estimate – October – December 2016 Finalize BCA analysis, Hydraulics & Geotechnical work – October – December 2016 Submit final package to FEMA for approval and award of Phase 2 funding to
proceed with final design and construction – December 23, 2016