
SLIDE 1
Making Clean Local Energy Accessible Now
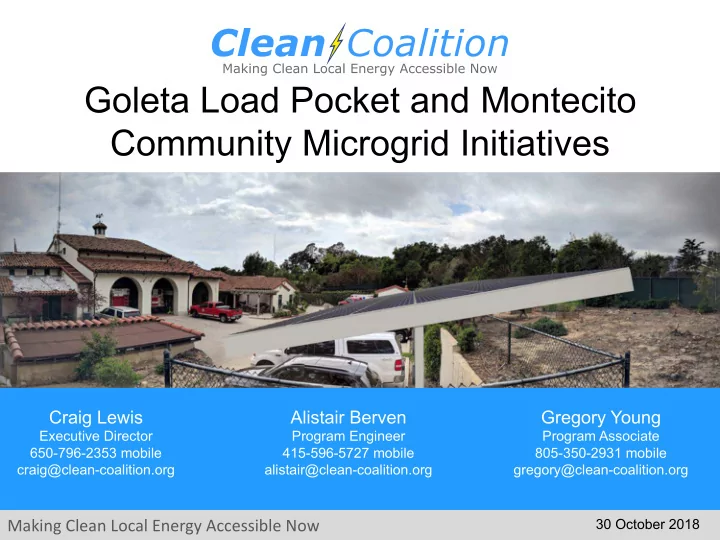
Goleta Load Pocket and Montecito Community Microgrid Initiatives
30 October 2018
Craig Lewis
Executive Director 650-796-2353 mobile craig@clean-coalition.org
Gregory Young
Program Associate 805-350-2931 mobile gregory@clean-coalition.org
Alistair Berven
Program Engineer 415-596-5727 mobile alistair@clean-coalition.org