
SLIDE 1
MONTECITO SANITARY DISTRICT
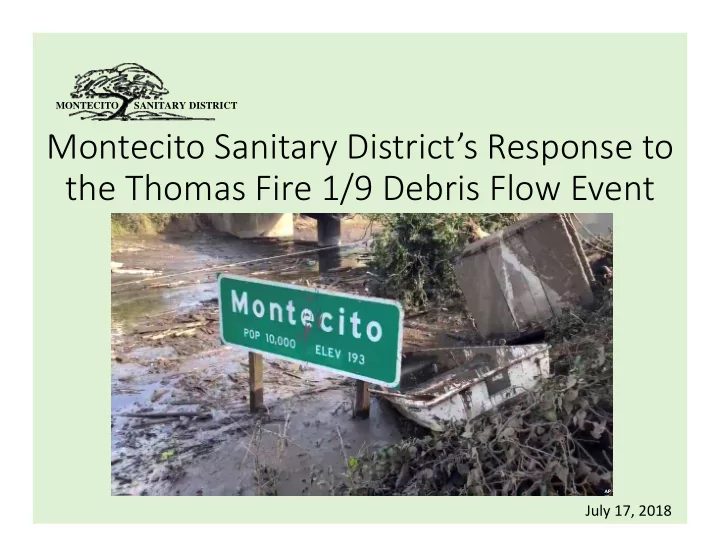
Montecito Sanitary District’s Response to the Thomas Fire 1/9 Debris Flow Event
July 17, 2018
Montecito Sanitary Districts Response to the Thomas Fire 1/9 Debris - - PowerPoint PPT Presentation
MONTECITO SANITARY DISTRICT Montecito Sanitary Districts Response to the Thomas Fire 1/9 Debris Flow Event July 17, 2018 MONTECITO SANITARY DISTRICT Outline of Presentation Background information on the District Overview of the
MONTECITO SANITARY DISTRICT
July 17, 2018
MONTECITO SANITARY DISTRICT Outline of Presentation
MONTECITO SANITARY DISTRICT Organization Chart
MONTECITO SANITARY DISTRICT
MONTECITO SANITARY DISTRICT
MONTECITO SANITARY DISTRICT District Service Area
District Boundary Sewer Lift Stations MSD Sewer Treatment Plant
MONTECITO SANITARY DISTRICT Jan 8th Evacuation Order
Mandatory Evacuation Voluntary Evacuation
MONTECITO SANITARY DISTRICT
View of Highway 101 looking west from Olive Mill Road overpass
MONTECITO SANITARY DISTRICT
Mud in Electrical Room
MONTECITO SANITARY DISTRICT
Mud in Dry Well of Sewer Lift Station
MONTECITO SANITARY DISTRICT
Debris and Hazards at Hot Springs Road
MONTECITO SANITARY DISTRICT
Mud and Debris in Sewer Easement south of Glen Oaks Neighborhood
MONTECITO SANITARY DISTRICT 1/9 Debris Flow Event
Summerland Sanitary District Pacific Ocean City of Santa Barbara National Forest
MONTECITO SANITARY DISTRICT
Morning meeting with MSD Operations Staff and Inspectors to discuss locations for days work
Once sewer manholes were located, Blois Construction (hired by MSD) cleared debris so manholes could be assessed for damage or debris in pipelines
MONTECITO SANITARY DISTRICT
Blois Construction (hired by MSD) cleared debris so access to manholes within our easement could be assessed for damage or debris in pipelines
MONTECITO SANITARY DISTRICT
Blois Construction (hired by MSD) cleared debris and marked the sewer manholes in green so manholes could be assessed for damage or debris in pipelines
MONTECITO SANITARY DISTRICT
Sewer manhole marked in green so manholes could be assessed for damage or debris in pipelines
MSD Staff and Inspectors opened
manholes to see if manhole was damaged or if debris is in the pipeline below
MONTECITO SANITARY DISTRICT Condition Assessment
MSD Staff and Inspectors assessed sewer collection system (manholes and pipelines) to create daily maps
MONTECITO SANITARY DISTRICTCondition Assessment
MSD hired National Plant Services to clean the debris from the sewer manholes and pipelines based on the condition assessment mapping
MONTECITO SANITARY DISTRICT
MSD hired National Plant Services to clean the debris from the sewer manholes and pipelines
MSD hired National Plant Services to clean the debris from the sewer manholes and pipelines‐ this is an example of the debris that was removed
MONTECITO SANITARY DISTRICT
National Plant Services brought the mud and debris from the sewer manholes and pipelines to the MSD Sewer Treatment Plant to be processed
MONTECITO SANITARY DISTRICT
MSD hired National Plant Services to video inspect the pipelines to confirm debris was removed and assess the pipeline condition
MONTECITO SANITARY DISTRICT
Video Inspection shows debris in 8” VCP sewer pipeline
MONTECITO SANITARY DISTRICT
Video Inspection shows 6” rock in 8” sewer pipeline
MONTECITO SANITARY DISTRICT
Sewer Pipeline Break Sewer Pipeline full of Debris Sanitary Sewer Overflow (due to storm water intrusion and debris blocked pipes)
MONTECITO SANITARY DISTRICT
Sewer Manhole ripped apart Lined Sewer Pipeline ripped apart
MONTECITO SANITARY DISTRICT
Sewer Manhole ripped apart marked in green Blois Construction, hired by MSD, repaired sewer pipeline and manhole
MONTECITO SANITARY DISTRICT
Blois Construction, hired by MSD, encased the sewer pipeline in concrete
MONTECITO SANITARY DISTRICT
Blois Construction, hired by MSD, repaired manhole, protected manhole with rocks, and concrete encased sewer pipeline
MONTECITO SANITARY DISTRICT
Sewer Pipeline Break Sewer Pipeline full of Debris Sanitary Sewer Overflow (due to storm water intrusion and debris blocked pipes)
MONTECITO SANITARY DISTRICT
Sewer pipeline and encasement ripped apart Boulders already broken apart by Caltrans Caltrans and County Flood Control granted MSD a 48 hour time period to complete the pipeline repairs
MONTECITO SANITARY DISTRICT
MSD hired Blois Construction to complete repairs Blois Construction, hired by MSD, installed 8” PVC gravity pipe in a steel casing that will be encased in reinforced concrete
MONTECITO SANITARY DISTRICT
MONTECITO SANITARY DISTRICT
MONTECITO SANITARY DISTRICT
Repaired concrete encased sewer pipeline
MONTECITO SANITARY DISTRICT
The concrete encased sewer pipeline is below the natural creek channel
MONTECITO SANITARY DISTRICT
Sewer Pipeline Break Sewer Pipeline full of Debris Sanitary Sewer Overflow (due to storm water intrusion and debris blocked pipes)
MONTECITO SANITARY DISTRICT Romero Creek
MSD hired Blois Construction to repair the damaged concrete encasement surrounding the sewer main
MONTECITO SANITARY DISTRICT Romero Creek
Blois Construction repaired the damaged concrete encasement surrounding the sewer main
MONTECITO SANITARY DISTRICT
Repaired concrete encasement around sewer pipeline
MONTECITO SANITARY DISTRICT MSD Treatment Plant
Aeration basins (biological treatment process) Dissolved Air Flotation Thickener (solids handling) Secondary Clarifiers (clarification) During the January 9th Thomas Fire Debris Flow event, MSD treatment plant was NOT directly impacted by the debris flows. However, there was debris that entered the treatment plant by flowing through the sewer collection system. Influent Pump Station Chlorine Contact Basin (disinfection) Aerobic Digester (solids handling) Belt Press (solids handling)
MONTECITO SANITARY DISTRICT Influent Flow
January 9, 2018 Typical Day Typical day influent is tan in color, has a trace amount of solids material, and has a musty odor On the morning
influent was a blackish‐brown slurry and had an earthy odor; the debris in the collection system was making its way to the treatment plant. This is what the influent flow looked like for weeks.
MONTECITO SANITARY DISTRICT Inorganic Material in
Debris Flow Typical inorganic material (sand, plastics, etc.) Over the next 3 weeks, we took in 12 tons of grit, mud, sand, and silt. From then it took 6 months for our system to fully recover. We had to very gradually pump out the inorganic solids, only as our biological treatment process began to heal, re‐ populate, and thrive again. This was a prolonged recovery period because
reductions.
MONTECITO SANITARY DISTRICTPlant Flow (gallons per day)
Thomas Fire Debris Flow Before the fire, our average plant flow was 550,000 gallons per day. During the evacuations, fewer residents meant less toilet flushing, less showering, less water down the drains, and ultimately less wastewater into the treatment plant. ALL TIME low flow Flows have returned to 450,000 gallons per day
MONTECITO SANITARY DISTRICT Adapting to flow
With very low flows to the treatment plant both the hydraulic and the solids residence times in these tanks were far beyond our target
plant dropped below half of normal, we took half of our tanks offline. As you can see with the red X, we took an aeration basin
clarifiers.
MONTECITO SANITARY DISTRICT
One Aeration Basin Offline
MONTECITO SANITARY DISTRICT
Secondary Clarifier Offline
MONTECITO SANITARY DISTRICT Sustaining Plant Microbiology
Once we adapted to the low flows, our next challenge was sustaining the health of
Our treatment process is absolutely reliant on living, breathing microorganisms that we receive regularly when we are receiving human sanitary sewer waste. These microorganisms, among others, are what we like to see. When these microorganisms are thriving, our treatment performance is at its best. Stalked Ciliates
MONTECITO SANITARY DISTRICT
These worms are associated with sub‐
debris flow, we were striving to prevent these worms by maintaining the healthy, beneficial microorganisms that ultimately keep us in permit compliance. Human sanitary sewer waste is the food that good microorganisms need to eat in order to
basically starving.
MONTECITO SANITARY DISTRICT Sustaining Plant Microbiology
We needed a supplemental food source to keep the healthy microorganisms
dogfood as an alternative food source. In the wastewater industry, it is not uncommon to use dogfood in this
supplemented with dogfood for 17 days (150 lbs per day) until Montecito was repopulated and the plant started to receive human sanitary sewer waste again.
MONTECITO SANITARY DISTRICT Analyzing Trends
Debris Flow Typically 2‐4 NTU 58 NTU Water Clarity Effective adjustments: Increased polymer dose to aid with particle settling and increased chlorine dose to strengthen disinfection.
MONTECITO SANITARY DISTRICT Effluent Turbidity
Debris Flow Permit Limit
MONTECITO SANITARY DISTRICT Total Coliform
5 10 15 20 25
MPN / 100 mL
EFFLUENT Total Coliform Monthly 7‐day Median
Total Coliform 7 day Median Total Coliform 7 day Median Limit
Debris Flow Permit Limit This is the performance metric that could shut down local beaches if we exceed the 23 MPN, 7‐day median permit limit.
MONTECITO SANITARY DISTRICT
5 10 15 20 25 30 mg/L
EFFLUENT Monthly Average Total Suspended Solids
Monthly Average Total Suspended Solids Montly TSS Permit Limit
Debris Flow Permit Limit
MONTECITO SANITARY DISTRICT Effluent CBOD
5 10 15 20 25 30 mg/L
EFFLUENT Monthly Average CBOD
Monthly Average CBOD Monthly CBOD Permit Limit
Permit Limit Debris Flow
MONTECITO SANITARY DISTRICT
January 9, 2018 Typical Day Effluent is crystal clear Effluent is quite clear
MONTECITO SANITARY DISTRICT Repopulation following
MONTECITO SANITARY DISTRICT
Thomas Fire Area Extreme Risk High Risk All MSD Sewer Lift Stations located in Extreme Risk areas MSD Treatment Plant
MONTECITO SANITARY DISTRICT
MONTECITO SANITARY DISTRICT
MONTECITO SANITARY DISTRICT
MONTECITO SANITARY DISTRICT
Capped laterals at about 67 properties
MONTECITO SANITARY DISTRICT
If the manhole lid floats away during a future debris flow the protector would capture the debris and prevent it from entering the pipeline system. The protector is foldable for easy installation.
MONTECITO SANITARY DISTRICT
The plywood sits on the manhole concrete shelf which allows sewer to continue flow to the next pipeline. Protectors can be lowered by one person without having to enter the manhole.
MONTECITO SANITARY DISTRICT
In February sand bags were placed to prevent future debris flows from entering the lift station. The sand bags were removed in May after the rainy season.
MONTECITO SANITARY DISTRICT On‐Site Diesel Storage
Diesel storage is located at the MSD Treatment Plant for the backup generator.
MONTECITO SANITARY DISTRICT Backup Generator
Diesel Generator has an automatic transfer switch, is capable of powering the entire facility, and is tested monthly
MONTECITO SANITARY DISTRICT Auxiliary Pump and Piping
An additional auxiliary pump and piping could be used if influent flow to the treatment plant or lift stations are very high.
MONTECITO SANITARY DISTRICT
MONTECITO SANITARY DISTRICT