
SLIDE 1
Making Clean Local Energy Accessible Now
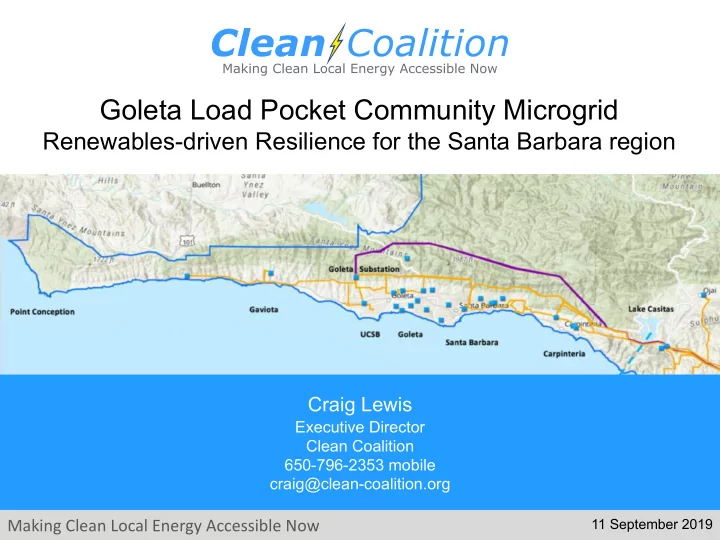
Goleta Load Pocket Community Microgrid
Renewables-driven Resilience for the Santa Barbara region
11 September 2019
Goleta Load Pocket Community Microgrid Renewables-driven Resilience - - PowerPoint PPT Presentation
Goleta Load Pocket Community Microgrid Renewables-driven Resilience for the Santa Barbara region Craig Lewis Executive Director Clean Coalition 650-796-2353 mobile craig@clean-coalition.org Making Clean Local Energy Accessible Now 11
11 September 2019
2
3
4
represents about 25% of the energy mix.
parking structures, and rooftops; and 200 MW represents about 7% of the technical siting potential.
solar+storage requirements.
5
6
7
8
Source: CPUC FireMap, ESRI, SCE DRPEP
9
10
11
12
13
14
2.5 5 10 30 65 100 5 25 60 95 97 98.5 100 100 100 100 1 DAY 2 DAYS 3 DAYS 1 WEEK 2 WEEKS 3 WEEKS 1 MONTH 2 MONTHS 3 MONTHS 6 MONTHS
Gas Electricity
60% electric customers restored in 3 days. 60% gas restoration takes 30 times longer than electricity
Source: The City and County of San Francisco Lifelines Study
2010 San Bruno Pipeline Explosion
15
16
17
Source: Santa Barbara County OEM
18
19
20
Tier 2 & 3 Loads
Autonomously controllable microgrid relay/switch (open, closed)
Montecito Fire District Southern Portion Montecito Union School
Coast Village Community Microgrid
Montecito Water District
Hot Springs Feeder (16kV)
21
22
23
24
Source: SCE LCR RFP April 22, 2019
25
26
Serves Remote Loads
Serves Local Loads
Serves Onsite Loads
5 kW 50+ MW 500 kW
27
28
Sources: CPUC, CEC, SEIA and German equivalents.
10,000 15,000 20,000 25,000 30,000 35,000
2002 2006 2007 2008 2009 2010 2011 2012
California Germany
29
400 600 800 1,000 1,200 1,400 1,600 1,800 2,000 up to 10 kW 10 to 30 kW 30 to 100 kW 100 kW to 1 MW
Source: Paul Gipe, March 2012
22.5% 26% 23.25% 9.25% 19%
30
* For projects not sited on residential structures or sound barriers.
31
32
33
the largest disaster recover/supply non-profits in the world).
foot pharmaceutical warehouse.
zones, internationally. Cold storage cannot be without power.
indefinite renewables- driven backup power.
34
320 kW PV 676 kWh Li 600 kW genset; 4000 gal. fuel
designed to cover annual consumption.
shift the generation to more valuable times, and provide Resiliency.
the back-up”.
stay operational in the event
causes interruption of electricity.
35
massive parking area solar potential is unused.
able to be considered due to policy prohibitions around exporting energy from a battery to the grid – even though the energy is 100% stored solar.
siting potential, 427 kW more rooftop and 386 kW in parking lots.
already sized for the expansion and is just awaiting the policy innovation!
36
37
38
39
40
41
crucial to keep operational at all times, including during grid outages. Tier 1 loads usually represent about 10% of the total load.
doing so does not threaten the ability to maintain Tier 1 loads. Tier 2 loads are usually about 15% of the total load.
about 75% of the total load, and are maintained when doing so does not threaten the ability to maintain Tier 1 & 2 loads.
42 10 20 30 40 50 60 70 80 90 100 10 20 30 40 50 60 70 80 90 100 Tier 1 = Critical load, ~10% of total load Percentage of total load Percentage of time Tier 3 = Discretionary load, ~75% of total load Tier 1 = Critical, life-sustaining load, ~10% of total load Tier 2 = Priority load, ~15% of total load
43
contracted energy capacity (kWh)
Owner Reserve Owner Reserve
44
Tier 2 & 3 Loads
Autonomously controllable microgrid relay/switch (open, closed)
Montecito Fire District Southern Portion Montecito Union School
Coast Village Community Microgrid
Montecito Water District
Hot Springs Feeder (16kV)
45
Ecoplexus WDG solar project at the Valencia Gardens Apartments in San Francisco, ~800 kW equivalent to ~80% of annual load.
46
Source: PG&E, Jul2019
47
48
49
50
51
52
53
54
55
56
57
58
59
60
61
62
63
64
65
Puente Peaker Plant in Oxnard
66
Source: PG&E, Jul2019