logistics
play

Logistics Paper summaries on Tone Reproduction Tone Reproduction - PDF document

Logistics Paper summaries on Tone Reproduction Tone Reproduction Any takers? Computer Graphics as Virtual Photography Tone/Color Reproduction (On the home stretch) Where are we? real camera photo Photographic Photography:


  1. Logistics • Paper summaries on Tone Reproduction Tone Reproduction – Any takers? Computer Graphics as Virtual Photography
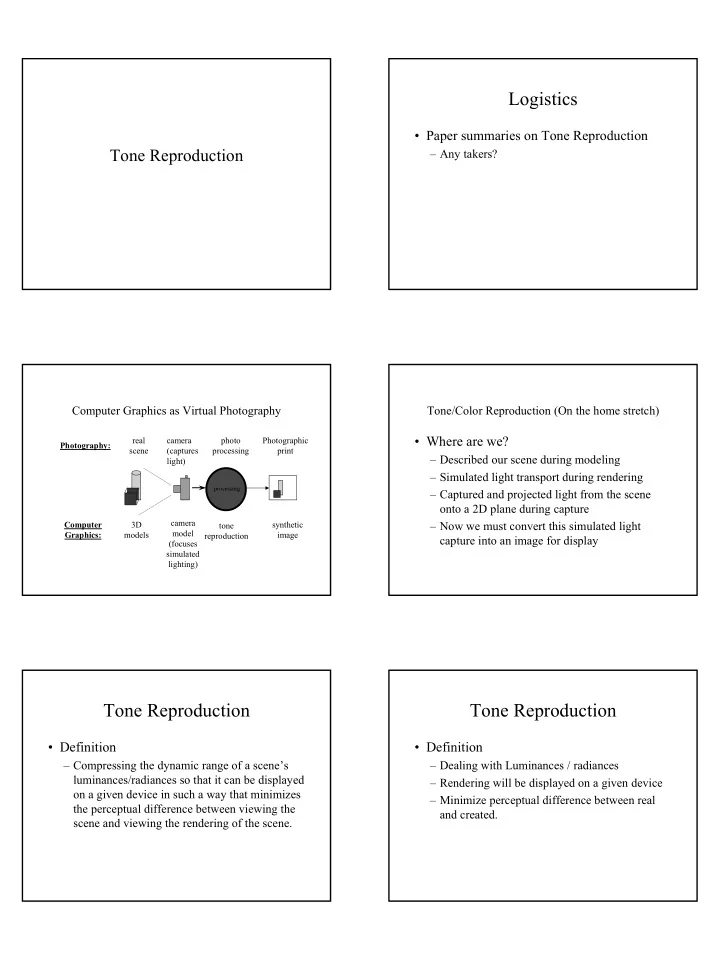
 Tone/Color Reproduction (On the home stretch) • Where are we? real camera photo Photographic Photography: scene (captures processing print – Described our scene during modeling light) – Simulated light transport during rendering processing – Captured and projected light from the scene onto a 2D plane during capture camera Computer 3D synthetic – Now we must convert this simulated light tone model Graphics: models image reproduction capture into an image for display (focuses simulated lighting) Tone Reproduction Tone Reproduction • Definition • Definition – Compressing the dynamic range of a scene’s – Dealing with Luminances / radiances luminances/radiances so that it can be displayed – Rendering will be displayed on a given device on a given device in such a way that minimizes – Minimize perceptual difference between real the perceptual difference between viewing the and created. scene and viewing the rendering of the scene.

  2. Tone Reproduction Tone Reproduction • Radiance / Luminance • Luminance levels – Flux arriving at or leaving from a given point or surface in a given direction . – Radiance measured in W / m 2 /sr dA – Luminance measured in cd/m 2 (nit) Sky = 12400 nits Trees = 64 nits Tone Reproduction Tone Reproduction • Using 0 – 1 to indicate light intensity • Simple Linear tone reproduction – What does 1 mean? • CG tends to use intensity space of output device • Images optimized for a given output device. • In typical CG apps, tone reproduction is simply linear scaling. Light source = Searchlight Light source = firefly Tublin-Rushmeier (1993) Tone Reproduction Tone Reproduction • Why bother • Basic pipeline [Tumblin93] – Human response to light is neither simple nor linear. – Most display devices are not linear – Incorrect response modeling results in incorrect perception of results.

  3. Tone Reproduction Tone / Color Reproduction • Basic solution • Response / Observer – How does a system (like the human visual system or photography) respond to the collected light • Display – How do we translate that response using a particular output device (like a CRT or printer) Response Models Human Visual Response • Applying response/observe model will result in the luminances as seen by your display observer. – I.e. Will be in luminance range of your output device. • Observer/Response Models – Human Visual System – Photographic Systems Human Visual Response Human Visual Response • Pupil • Levels of Brightness Response – Regulates the amount of light that gets to the retina – Scotopic • Photoreceptors • 10 -6 to 10 2 cd/m 2 /primarily rods – Rods – Photopic • 75 - 150 million • 0.01 to 10 8 cd/m 2 / Primarily Cones • sensitive to 10 -6 to 10 2 cd/m 2 (low light levels) • Achromatic (detects “brightness”) – Mesopic – Cones • 0.01 to 10 2 cd/m 2 • 6 - 7 million • Both rods and cones • sensitive to 0.01 to 10 8 cd/m 2 (high light levels) • Little known -- active area of research • Responsible for color vision

  4. Human Visual Response Human Visual Response • Spectral Sensitivity • Spectral response – Human Visual System is sensitive to light in the wavelength range of approx. 350 - 700 nm. – Sensitivity changes dependent on illumination level Human Visual System Human Visual System • Acuity • Acuity also changes dependent on – Ability to luminance level resolve spatial detail • Snellen Chart – View from 20 ft away – Line 8 subtends 1 min of visual angle – People who can read this is said to have 20/20 vision Human Visual System Human Visual System • Response at different illumination levels • Adaptation – Our vision system has the ability to adapt to a given luminance level – Light Adaptation - from darkness to light – Dark Adaptation - from brightness to dark – Adaptation is gradual, not immediate

  5. Human Visual System Human Visual System • Threshold Studies • Light adaptation – determines the threshold at which a person can notice the change between a light sample given a certain background luminance. Human Visual System Human Visual System • Light adaptation • Dark adaptation Human Visual System Human Visual System • Ferwerda’s model • Dark Adaptation – Scales luminances as to preserve perceived contrast using psychophysical data as a guide. • L w = mL d – Different models for scotopic and photopic vision with slider to blend the two to simulate mesopic vision. • m will vary dependent upon whether scene is in scotopic, photopic, or mesopic range.

  6. Human Visual System Photographic Response • CG Tone Reproduction Operators • An alternative to modeling visual response directly. – “Tone Reproduction and Physically Based Spectral Rendering” by Devlin, et al. • Models response to photographic materials. EUROGRAPHICS 2002. – Questions? Photographic Response Photographic Response • Why bother with photographic model? • Print Photography – Far better understood than human visual system. Camera Film Process Negative – Optimized for human viewing – Artistic photography – Composition of CG elements with scenes Printer Paper Print Process captured on film. Photographic Response Photographic Response • Brightness Response - high level response • Photographic Materials of an emulsion to light – Comprised of microscopic grains of silver • Spectral Sensitivity - Response of a material halide in a gelatin (emulsion) to different wavelengths of light – Latent image formed when exposed to light • Acuity - Level at which material can – Silver halide converted to metallic silver during reproduce spatial details processing. • Graininess - Observed variation due to grain – Converted silver results in opacity distribution

  7. Photographic Response Photographic Response • Sensitometry exposure density – The science of measuring the sensitivity of E = It D = log (O) photographic materials I = Illuminance (lux) O = opacity = 1 / T – Each characteristic has its own unique t = time (sec) T = transmission sensitometric measure. E = exposure (lux-sec) = I t / I o I t = transmitted light I o = incident light Photographic Response Photographic Response gamma - slope of region II speed - indicates • Brightness Response / Characteristic Curve gives contrast range sensitivity to light 3 3 I - toe III II - straight line y section IV 2 2 t i III - shoulder s n II γ IV - area of e γ D solarization 1 1 I γ - gamma 0 0 -2 S 0 2 Log Exposure -2 0 2 Photographic Response - Speed Photographic Response - Gamma Original Original 100 Speed Film Low Contrast 800 Speed Film Medium Contrast High Contrast 400 Speed Film

  8. Photographic Response Photographic Response Spectral Response Spectral Response 100 panchromatic 0 100 orthochromatic 0 Original Panchromatic Blue Sensitive 100 blue sensitive 0 300 400 500 600 Photographic Response - Acuity Photographic Response - Acuity point spread function modulation transfer function 100 80 60 (%) 40 Without MTF With MTF With MTF & Grain 20 0 0 40 80 120 spatial freq. (cycles/mm) Photographic Response - Grain Photographic Response - Grain Selwyn Granularity: rms deviation: N Σ ( ∆ D i ) 2 2 = 1 (2A) σ σ G = Original w/grain ∆ D i = deviation of Magnified 2x Magnified 4x A = area of scanning sample i from aperture the mean

  9. Photographic Response Modeling Photographic Response • High level description of photographic • Uses sensitometric measures to model response characteristics of photo materials – Can model process at grain level but • Physically based impractical to do so for our purposes. • Built using an imaging pipeline where each – Thankfully, all of these sensiometic module in the pipe represents an image measurements are available for photo materials processing operation. from the manufacturer. Modeling Photographic Response Modeling Photographic Response input image • Must run thru pipeline twice, once for capture on film and once for printing spectral expose resolution sensitivity • Result of model – Image of floats [0, 1] exposure – Represents transmission or reflection values convert to density granularity transmission/ response reflection negative density conversion or print Modeling Photographic Response Modeling Photographic Response • Recall • Virtual Darkroom Applet – Prints are reflective media – Are not visible unless illuminated – values from model must be modified to account for the luminance / color characteristic of the assumed print illumination – Thankfully, luminance / color of CRTs approximates normal interior viewing conditions fairly well.

  10. Tone Reproduction Tone Reproduction • An almost final word on Tone Reproduction • Summary – Things we did not discuss today: – Means of compressing dynamic range of scene • Display model to fit that of display • Color • Viewing conditions also affect perception – Observer / Response Model – TR Operator should also make modifications if viewing • Human Visual System conditions of world observer does not match that of display observer • Photographic Systems – These issues + a complete photographic model, will be – Device Model discussed next time. – Breaktime…

Download Presentation
Download Policy: The content available on the website is offered to you 'AS IS' for your personal information and use only. It cannot be commercialized, licensed, or distributed on other websites without prior consent from the author. To download a presentation, simply click this link. If you encounter any difficulties during the download process, it's possible that the publisher has removed the file from their server.

Recommend


More recommend