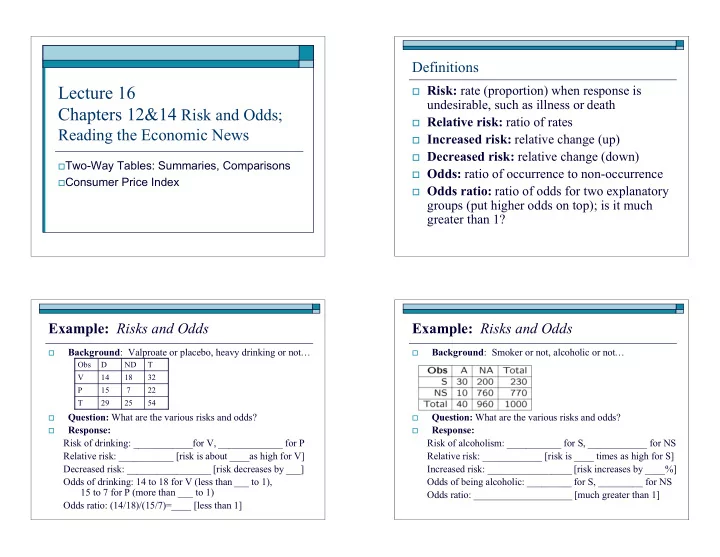
Lecture 16 Risk: rate (proportion) when response is undesirable, - - PowerPoint PPT Presentation

lecture 16
SMART_READER_LITE
LIVE PREVIEW

Lecture 16 Risk: rate (proportion) when response is undesirable, - - PowerPoint PPT Presentation

Definitions Lecture 16 Risk: rate (proportion) when response is undesirable, such as illness or death Chapters 12&14 Risk and Odds; Relative risk: ratio of rates Reading the Economic News Increased risk: relative change (up)


slide-1
SLIDE 1

Lecture 16 Chapters 12&14 Risk and Odds;

Reading the Economic News

Two-Way Tables: Summaries, Comparisons Consumer Price Index

Definitions

Risk: rate (proportion) when response is

undesirable, such as illness or death

Relative risk: ratio of rates Increased risk: relative change (up) Decreased risk: relative change (down) Odds: ratio of occurrence to non-occurrence Odds ratio: ratio of odds for two explanatory

groups (put higher odds on top); is it much greater than 1?

Example: Risks and Odds

  • Background: Valproate or placebo, heavy drinking or not…
  • Question: What are the various risks and odds?
  • Response:

Risk of drinking: ____________for V, _____________ for P Relative risk: ___________ [risk is about ____as high for V] Decreased risk: _________________ [risk decreases by ___] Odds of drinking: 14 to 18 for V (less than ___ to 1), 15 to 7 for P (more than ___ to 1) Odds ratio: (14/18)/(15/7)=____ [less than 1]

54 25 29 T 22 7 15 P 32 18 14 V T ND D Obs

Example: Risks and Odds

  • Background: Smoker or not, alcoholic or not…
  • Question: What are the various risks and odds?
  • Response:

Risk of alcoholism: ___________ for S, ____________ for NS Relative risk: ____________ [risk is ____ times as high for S] Increased risk: _________________ [risk increases by ____%] Odds of being alcoholic: _________ for S, _________ for NS Odds ratio: ____________________ [much greater than 1]

slide-2
SLIDE 2

Example: Risks & Odds for No Relation

  • Background: Counts expected if no relationship…
  • Question: What would risks and odds be if no relationship?
  • Response:

Risk of alcoholism: ___________ for S, ____________ for NS Relative risk: ____________ [risk is ___ times as high for S] Increased risk:________________ [risk increases by ___%] Odds of alcoholic: ___________ for S, ____________ for NS Odds ratio: (9.2/220.8)/(30.8/739.2)=1 [same odds]

Cautions in Interpreting Risks

A relative risk without a baseline risk given does

not provide enough info to judge the impact of the explanatory variable on the response.

Risks quoted for samples don’t necessarily apply

to larger populations. (Chi-square test needed.)

Example: Missing Baseline Risk

  • Background: The risk of contracting amyotrophic

lateral sclerosis (ALS) is 12 times as high for Italian pro & semi-pro soccer players as it is for others!

  • Question: Should Italians avoid playing pro soccer?
  • Response: It depends on the __________________:

Is it 2/100 (worrisome) or 2/76,000 (not so bad)?

In fact baseline risk is 2 per 76,000, like the table on the____. 200 174 26 T 100 98 2 Not IS 100 76 24 IS T No ALS ALS Obs 100,000 99,990 10 T 76,000 75,998 2 Not IS 24,000 23,992 8 IS T No ALS ALS Obs

Example: Risk in Sample vs. Population

  • Background: Experiment on bipolar alcoholics yielded

Risk of drinking: 14/32=0.44 for V, 15/22=0.68 for P Relative risk: 0.44/0.68=0.65 [risk is about 2/3 as high for V]

  • Question: Would the risk of heavy drinking decrease for all

bipolar alcoholics who take Valproate?

  • Response:

54 25 29 T 22 7 15 P 32 18 14 V T ND D Obs

slide-3
SLIDE 3

Example: Economics and Consumption

  • Background: For statistical analysis of consumer

habits, economists consider a typical “market basket”

  • f goods.
  • Question: Besides food, shelter, and clothing, what

do we spend money on?

  • Response: food/beverages, housing, apparel,

__________ __________ __________ __________ __________

Definitions in Economic News (Chapter 14)

Price index number: measures relative cost of a single

item compared to cost in base year.

“market basket” categories: food/beverages, housing,

apparel, transportation, medical care, recreation, education, other

Consumer Price Index (CPI): relative change in cost

  • f typical market basket

Year 1960 1970 1980 1990 2000 2008 2009 CPI 29.6 38.8 82.4 130.7 172.2 215.3 214.5 Price at time 2 = price at time 1 CPI at time 2

CPI at time 1

Example: Calculation with CPI

  • Background: CPI was 172.2 in 2000, 215.3 in 2008.

South Park’s Cartman received $2 in 2000.

  • Questions: If this was average for the time, how much

should the going rate be in 2008?

  • Response: Compute

Note: CNN claimed the average was $2.64 in 2008. Was Cartman underpaid for his tooth?

Example: More Calculation with CPI

  • Background: CPI was 29.6 in 1960, 215.3 in 2008.
  • Question: How much should Dr. Pfenning have been

paid for a tooth in 1960, to be consistent with the 2008 rate of $2.64?

  • Response: Compute

Note: If Dr. Pfenning received a quarter in 1960, was she underpaid for her tooth?

slide-4
SLIDE 4

Example: More Calculation with CPI

  • Background: CPI was 207.3 in 2007, 215.3 in 2008.
  • Question: Pitt’s in-state CAS tuition was $12,106 in
  • 2007. What should it have been in 2008?
  • Response: Compute

Note: Tuition went up to $12,832 in 2008. Was this out of line? Extra Credit (Max 5 pts.) PUSHING THE HELMET HABIT The percentage of bicyclists wearing helmets has jumped dramatically in eight years, but still half of all riders never or rarely wear helmets when they ride, a new national survey

  • shows. Last year, 50 percent of the more than 80 million riders

wore helmets. Bike-related crashes kill 900 people across the United States each year and send another 567,000 people to hospital emergency rooms, according to the CPSC. Wearing a helmet can reduce risk of injury by 85 percent. Construct a two-way table from the information given, and determine the risks of injury for helmet-wearers and non- wearers.