
SLIDE 1
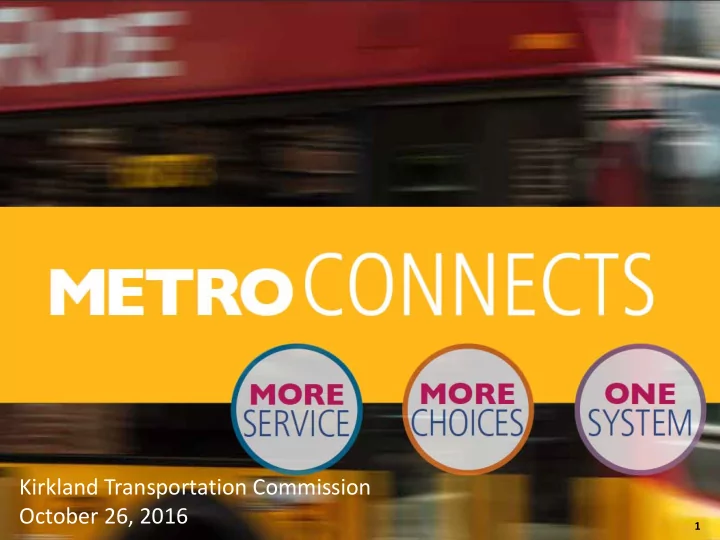
Kirkland Transportation Commission October 26, 2016
1
Kirkland Transportation Commission October 26, 2016 1 Why now? By - - PowerPoint PPT Presentation
Kirkland Transportation Commission October 26, 2016 1 Why now? By 2040 our region will increase by: What will it take to respond to these needs? 70% 1m 850k GROWTH in Metro service, from 3.5 million service hours to 6 million hours
Kirkland Transportation Commission October 26, 2016
1
2
What will it take to respond to these needs?
GROWTH in Metro service, from 3.5 million service hours to 6 million hours by 2040.
3
Where is Transit Going in the Future
How will transit support local development?
Redmond TMP Federal Way Comp Plan Shoreline Comp Plan Kirkland TMP
4
5
“This vision is intended to be our atlas as we create an integrated transportation system that connects people to
More frequent service
All-day service
More local service
Investments to make travel faster
On demand travel
Improved access to transit
Partnerships and Coordination
Behind-the-scenes investments
More Service, More Choices
6 6
service - 73% of residents would be within ½ mile of frequent service
buses
new transportation options
transit fast and reliable
7 7
smooth transfers between buses and light rail
be able to get to Link in 15 minutes by walking or by bus.
including new options for people with disabilities, better signs and wider aisles and doors
8
9
1.9 0.5 1.2
3.5M
HOURS
2.8 0.4 1.1
4.4M
HOURS
4.1 0.5 1.4
6.0M
HOURS
2015 2040 2025 2015 2025 2040
Total 100% 100% 100% Frequent 53% 64% 68% Express 14% 10% 9% Local 33% 26% 23%
Split of Service Hours
10
High Medium Low
needed by 2040
layover spaces by 50% by 2040
Preservation: Invest in
building and maintaining infrastructure
Expand our skilled workforce
11 Incremental Capital Investments 2018-2040
15 minutes 30 minutes 45 minutes 60 minutes
Travel times include initial wait times and the average time spent waiting to transfer. Represents trips starting at noon on weekdays. In the year: Starting from:
Downtown Kirkland
2016 2025 2040
2025 2016 2040
15 minutes 30 minutes 45 minutes 60 minutes
Travel times include initial wait times and the average time spent waiting to transfer. Represents trips starting at noon on weekdays. In the year: Starting from:
Downtown Kirkland
15 minutes 30 minutes 45 minutes 60 minutes
Travel times include initial wait times and the average time spent waiting to transfer. Represents trips starting at noon on weekdays. In the year: Starting from:
Downtown Kirkland
2025 2016 2040
– Facilitate partnerships – Build case for grants – Help inform biennial budgets
15
Continue work of METRO CONNECTS
staff and elected officials
committees (TAC)
increased collaboration
16
17
Current 2025 Network
18
Contact us: Graydon Newman Transportation Planner Graydon.Newman@KingCounty.gov 206-477-5862 Tristan Cook Community Relations Planner Tristan.Cook@KingCounty.gov 206-477-3842