
SLIDE 1
to you Why were here SORTAs Mission Regional transportation - - PowerPoint PPT Presentation
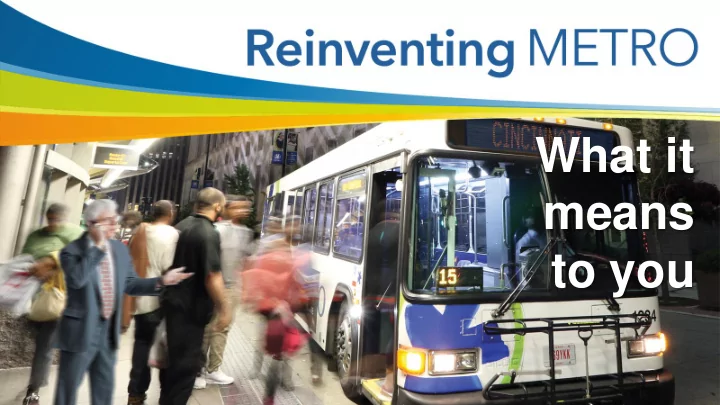
What it means to you Why were here SORTAs Mission Regional transportation connecting people and places, driving economic growth and expanding quality of life choices. By the numbers 14 million : Rides per year 46 : Total routes
Started Jan. 5, 2015 30+ years transit experience Previous work locations: Atlanta, Austin, Dallas, New Orleans, Philadelphia
Joined Metro in 2005 Oversees:
FREQUENCY
Wait time between buses Priority: Shorter waits, dependable service
SPAN
How long buses run each day Priority: Covering shift work
TRIP TIME
Time on the bus Priority: Faster trip times
CAPITAL FUNDING
Our Current Route System
concentrated in the urban core
Hamilton County, generally speaking, will be sustained at the .5% sales tax level
Hamilton County are contracted and subsidized by those counties and have higher fares
Ohio River are
New Routes & Route Alignment Changes
(.7% Sales Tax Level)
which serve suburban Hamilton County
circulator service
will be realigned or extended
improve
will be added
New Routes & Route Alignment Changes
(.9% Sales Tax Level)
more routes on the east and west side serving suburban Hamilton County
Corridors are built
busiest corridors in the Metro service area
New Routes & Route Alignments
(BRT Corridors)
traffic and bus-only lanes
service with limited stops
amenities like comfortable seats, Wi- Fi, stations with shelter and seating, real-time arrival screens, lighting, cameras and
BRT Station and Park & Ride BRT Station and Park & Ride BRT Station and Park & Ride BRT Station and Park & Ride
Route Frequency (current)
more blue the lines the more frequent the service
Downtown and Uptown focused, with less service in suburban Hamilton County
weekday averages between 6 am – 6 pm
Route Frequency
(.7% Sales Tax Level)
frequency within the current service area and including suburban Hamilton county
service and connections
Springdale and Blue Ash circulators are on-demand
Route Frequency
(.9% Sales Tax Level with BRT Corridors)
service
(BRT) adds fast and frequent service to the busiest corridors in the region
service provides convenient connections to the BRT service
High Frequency Routes (15-minute)
service includes 7 routes that operate every 15 minutes or less
service is reliable, convenient service
are the weekday averages from 6 am to 6 pm
High Frequency Routes (15-minute)
(.7% Sales Tax Level)
will have service every 15 minutes, including the new Galbraith Road crosstown
routes will operate at least every 15 minutes
will operate every 15 minutes or less
High Frequency Routes (15-minute)
(.9% Sales Tax Level)
high frequency network connecting the high frequency crosstown and local routes
service provides the convenience of not having to check the times of when the next bus is coming
Crosstown Routes (Current Service)
shade of green the less frequent the service
has 3 crosstown
routes operate primarily in the city
Crosstown Routes (Current Service)
(.7% Sales Tax Level)
crosstowns
demand circulator routes serving low density, job rich areas
move throughout the county without having to go downtown
Crosstown Routes (Current Service)
(.9% Sales Tax Level)
suburban crosstown routes
ability to use crosstown service to get to and from stations and where you need to go faster
routes
24-Hour Routes (Current)
Metro service departs downtown is 12:55 AM on weekdays
depart downtown at similar times on weekends
24-Hour Routes
(.7% & .9% Sales Tax Levels)
will have 24 hour a day service every day of the week
are the highest ridership routes in the Metro system
a large portion of Hamilton County
Increased Span
(.7% Sales Tax Level)
current service area will have earlier and/or later service
get to jobs that are not at the conventional 9 am – 5 pm times
Increased Span
(.9% Sales Tax Level)
BRT allows people to travel faster within that corridor and use local service to travel to and from home and work early in the morning or late at night
be expanded on both weekdays and weekends
scenario, multiple new transit centers and park & rides will be included. Their locations are yet to be determined.
riders with disabilities within our service area in 2017
service, we will reach even more of these customers and connect them to more places they need to go.
$6.4 million
$184 million
Future projected deficits over the next 10 years will require:
jobs and much-needed services.
2018* 2019 2028
Projected deficits (operating and capital)
$27.4 million $39.8 million $33.3 million
$62 million
$122 million
Operating budget Capital Budget * Balanced 2018 operating budget
for impact on service improvements (we assumed elimination of the city earnings tax)
– .5%: Sustainable service at current levels – .7%: Major service improvements in Cincinnati and Hamilton County – .9%: Transformed transit system includes Bus Rapid Transit (BRT)
To see all sales tax options, visit: www.reinventingmetro.com