
SLIDE 1
M I C R O T R A N S I T S O L U T I O N S -
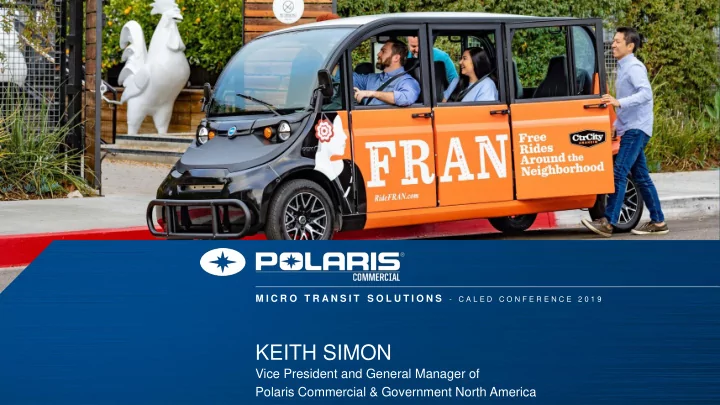
C A L E D C O N F E R E N C E 2 0 1 9Vice President and General Manager of Polaris Commercial & Government North America
KEITH SIMON
KEITH SIMON Vice President and General Manager of Polaris - - PowerPoint PPT Presentation
M I C R O T R A N S I T S O L U T I O N S - C A L E D C O N F E R E N C E 2 0 1 9 KEITH SIMON Vice President and General Manager of Polaris Commercial & Government North America Urban Mobility Trending Challenges Parking is a Drain on
M I C R O T R A N S I T S O L U T I O N S -
C A L E D C O N F E R E N C E 2 0 1 9Vice President and General Manager of Polaris Commercial & Government North America
KEITH SIMON
Urban Mobility Trending Challenges
2
Macro Trends Raising Questions about Urban Mobility
Click to edit footer
2-4%
fuel, & increased cost of doing business
Mass Movement of People to City Centers
84.2%
Areas by 2030
Urban Traffic Congestion is a Problem Parking is a Drain on Urban GDP
$413K
Avg potential tax production a mixed use building site can generate per acre downtown
More Distracted Pedestrians Public Health at Risk Due to Air Pollution
7,000,000
premature deaths in ‘14 due to air pollution
16%
pedestrian deaths
17%
idle time of internal combustion vehicles in many urban ops
Vehicles Causing Unnecessary Pollution Expensive, Large Vehicles Being Used Inefficiently
6/7
Internal combustion vehicles travel less than 25 miles a day in many urban ops
Eroding Public Transit Ridership
Decline in public transit ridership in top 50 cities (excluding NYC) since ‘08
Key Trending Questions
3
Key Questions Driving Economic Development
Click to edit footer
How do we maximize our Urban GDP? How do we keep our citizens healthy? How do we keep commuters safe?
The Polaris GEM Micro Transit Solution
4
LSVs are the Right Fit for Urban Mobility
Click to edit footer
Golf Carts Over the Road Vehicles
Electric Low-Speed Vehicle (LSV)
Manufactured for Golf Courses Manufactured for High Speeds More Street Legal Safety Features than a Golf Cart More Cost Effective, Sustainable & Safer for Pedestrians than an Over the Road Vehicle
Polaris GEM LSV Safety Features
5
Low Speed Keeps Pedestrians Safe I Features Keep Occupants Safe and Comfortable
Click to edit footer
✓ Front Wheel Disc Brakes ✓ 13” Street-Grade Tires ✓ Automotive Style Rear Drum Brakes ✓ High-Back Forward Facing Seats ✓ 3-pt SeatbeltsMax Speed 25 mph
Street Legal on all 35 mph Roads
✓ Windshield Wiper ✓ Automotive Glass Windshield ✓ Passes SAE Roof Crush Test ✓ High/Low Beam Headlights ✓ LED Turn Signals & Brake Lights ✓ Driver/Passenger Side-View Mirrors ✓ Integrated Doors ✓ Back-up Warning Signal ✓ Integrated Backup Camera Polaris GEM Cost Savings & Sustainability
6
Substantial Cost and Pollution Savings Potential
Click to edit footer
Vs internal combustion vehicles.MILLION $$
$$$$$$$$ $$$$$$$$ $$ $$
How do we maximize our Urban GDP?
7
Enabling Economic Growth through Micro Transit
Click to edit footer
CURRENT STATE FUTURE STATE
MICRO TRANSIT SYSTEM HIGH TRAFFIC CONGESTION$$$
Hard to Reach Hubs Inconvenient Last Mile Commute High Value Areas Consumed$$$
Easier to Reach Hubs Convenient & Efficient Last Mile Commute High Value Downtown Areas Freed to Develop How do we keep our citizens healthy?
8
Every Polaris GEM Used Saves 21 Trees
Click to edit footer Maintenance, Repair, & Operations Safety & Security Shuttling People
FUTURE STATE CURRENT STATE Unnecessary Size, Range, & Fuel Type
Pollution Why not use an all electric LSV?
✓Right Range ✓Right Price ✓Right Capability ✓Right for the Environment ✓Right Size
Unnecessary Pollution All Electric, Street Legal, 0 emissions How do we keep commuters safe?
9
Right Size, Speed, & Safety Features
Click to edit footer
FUTURE STATE CURRENT STATE
Pedestrian Fatalities are a High % of Traffic Deaths Pedestrian’s are seen earlier, with more time for the driver to react and stop, and lower chance of serious accident$$$
$
Less legal litigation, heath care related costs, etc. Costly legal litigation, heath care related costs, etc. Polaris GEM Micro Transit Partnerships
10
10 Million Micro Transit Rides Since 2016
Click to edit footer
Self Driving Micro-Transit Free Rides in California since 2013
Columbus, Oh
Santa Monica, Ca San Diego, Ca Long Beach, Ca Venice, Ca Marina Del Rey, Ca Free Rides Around the Neighborhood
FRAN Program
Albemarle, Va
Anaheim, Ca
Boston, Ma
How do we keep commuters safe? How do we keep our citizens healthy? How do we maximize
The Polaris GEM Solution
11
Making Mobility Easy
Click to edit footer
$$$
Easier to Reach Hubs Convenient & Efficient Last Mile Commute High Value Downtown Areas Freed to Develop All Electric, Street Legal, 0 emissions Urban Mobility Solutions Safer Pedestrians, bikers, scooters, etc.$
Less legal litigation, heath care related costs, etc. Polaris GEM Total Cost of Ownership
13
Save ~$18,658 & 41.9k lbs of CO2 / Vehicle with GEM vs. Over The Road Vehicles
Click to edit footer
Over The Road Internal Combustion Vehicles
Total Cost of Ownership
Annual CO2 Emissions
7,000 lbs Yes
Street Legal
Yes Yes
Factory Made for C&U Applications
No $16,780
Initial Acquisition Cost
$23,950 $360
Total Annual Cost of Operation
$2,820 $19,300
Total Cost/Vehicle Over 7-Year Life*
$43,690
How do higher speeds affect stopping distances?
14
High Speed = Longer Reaction Time & Stopping Distance…Higher Chance of Accidents
Click to edit footer
85+% fatality rate
if a pedestrian is struck
25 mph = max LSV speed
Over The Road (OTR) Vehicle Usage Data
15
Unnecessary Pollution, Unnecessary Cost, and Unnecessary Safety Risk
Click to edit footer
Device Vehicle Info Total Trips Total Distance (mile) Longest Trip (mile) Average
Trip (mile) Average
Day (mile) Drive Time (hr) Idle Time (hr) Idle time to runtime
8 2002 Ford Ranger 294 145 5.92 0.49 5.35 30.12 8.33 28% 9 2002 Ford Ranger 143 219 9.97 1.53 8.10 28.66 6.65 23% 10 1996 Ford E350 307 289 5.44 0.94 10.69 27.24 2.58 9% 11 2004 Chevy Express 301 404 7.06 1.34 14.95 42.39 5.40 13% 13 2002 Ford Ranger 397 644 7.79 1.62 23.85 76.72 12.23 16% 14 2011 Ford Fusion 169 1067 84.96 6.31 39.52 36.16 2.80 8% 15 2010 Ford Fusion 58 53 1.65 0.91 1.96 5.55 1.09 20% Totals 1669 2819 122.79 1.69 104.42 246.84 39.08 16%
Avg idle time is 16%
6/7 of the vehicles travel less than 25 miles a day High Idle Time
EVs Have 0 Idle Time
Short Travel Distances
Easily Serviceable by EV
0 0 0 1
What is the risk of higher speeds?
16
Greater Speeds, Much Greater Consequences
Click to edit footer