
SLIDE 1
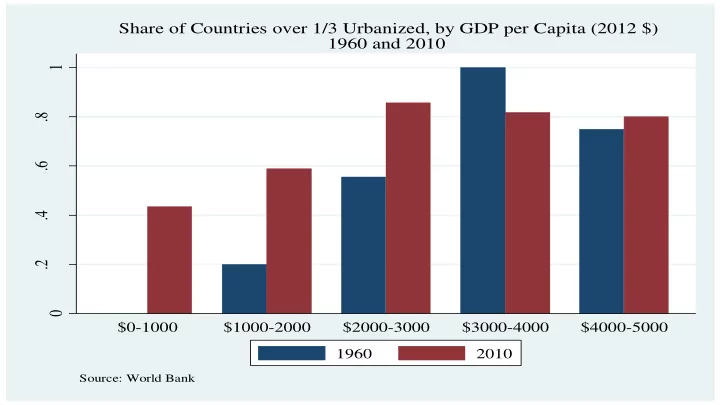
.2 .4 .6 .8 1 $0-1000 $1000-2000 $2000-3000 $3000-4000 $4000-5000
Source: World Bank
Share of Countries over 1/3 Urbanized, by GDP per Capita (2012 $) 1960 and 2010
1960 2010
Share of Countries over 1/3 Urbanized, by GDP per Capita (2012 $) - - PowerPoint PPT Presentation
Share of Countries over 1/3 Urbanized, by GDP per Capita (2012 $) 1960 and 2010 1 .8 .6 .4 .2 0 $0-1000 $1000-2000 $2000-3000 $3000-4000 $4000-5000 1960 2010 Source: World Bank Per Capita GDP Growth 1960-2010 (Poor
.2 .4 .6 .8 1 $0-1000 $1000-2000 $2000-3000 $3000-4000 $4000-5000
Source: World Bank
1960 2010
Congo, Dem. Rep. Burundi Liberia Niger Malawi Sierra Leone Central African Republic Afghanistan Uganda Rwanda Togo Nepal Zimbabwe Bangladesh Benin Kenya Cambodia Pakistan Senegal Cameroon Cote d'Ivoire Zambia Ghana Papua New Guinea India Nicaragua Sudan Bolivia Honduras Philippines Sri Lanka Iraq Egypt, Arab Rep. Morocco Guatemala Syrian Arab Republic Congo, Rep. El Salvador Ecuador China Algeria Thailand Jamaica Dominican Republic Peru Colombia South Africa Panama Costa Rica Malaysia Mexico Turkey Brazil Uruguay Chile Korea, Rep. Portugal Greece Spain Hong Kong SAR, China Singapore Japan
1 2 3 .2 .4 .6 .8 1 Urbanization in 1960
6 7 8 9 10 11 .2 .4 .6 .8 1 % Urbanization, 2010 Log of P.C. GDP 2010 PPP Fitted values
Share of Adults with B.A.s 2000 Per Capita GDP 2010 . .1 .2 .3 .4 .5 20000 40000 60000 80000 100000
.05 .1 .15 1 2 3 4 5
Image Features Derived from Pixels
Training Examples Machine Learning
Predicted Income
Test: New York City Test: Boston
.5 1 1.5 2 1 2 3 4 5
Smallest firms are in Quintile 1
Gautrain by Habib M’henni
Rwanda Mali Ghana India Moldova Iraq Egypt, Arab Rep. Morocco Guatemala Indonesia Ukraine Thailand Bulgaria South Africa Romania Malaysia Argentina Mexico Russian Federation Brazil Uruguay Poland Slovenia Cyprus Spain New Zealand Italy United Kingdom France Germany Japan Finland Canada United States Netherlands Sweden Australia Norway
.1 .2 4 6 8 10 12 Log of Per Capita GDP